Categories
code mental health productivity

The System – Creating An App To Live By

Groundhogs Day — The Start

Have you ever woken up and felt like you were reliving yesterday? That is the premise behind the movie Groundhog Day starring Bill Murray. Every day the main character wakes up just to relive the prior day all over again. While the movie script may be fiction, the idea behind Groundhog Day is something very real. Each day we strive to improve our lives so that tomorrow is better than today. But all too often we get that familiar feeling of "reliving yesterday" again and again. This feeling isn’t limited to a single day either. Next week/month/year frequently feels the same as last week/month/year. How can we combat this? How can we ensure that we are really making progress?

Benjamin Franklin observed this problem in himself and sought to make real change in his life by keeping a Virtue Journal. In this journal he listed out 13 virtues and tried to keep track of his progress in achieving them all. Over time, the same problems as before started to emerge. In the book Willpower Baumeister explains:

As he put it in Poor Richard’s Almanack: ’Tis easy to frame a good bold resolution; But hard is the Task that concerns execution. No matter how hard he tried, Franklin never could have kept that notebook clean, because some of the goals were bound to conflict at times. When, as a young journeyman printer, he tried to practice Order by drawing up a rigid daily work schedule, he kept getting interrupted by unexpected demands from his clients—and Industry required him to ignore the schedule and meet with them. If he practiced Frugality (“Waste nothing”) by always mending his own clothes and preparing all his own meals, there’d be less time available for Industry at his job—or for side projects like flying a kite in a thunderstorm or editing the Declaration of Independence. If he promised to spend an evening with his friends but then fell behind his schedule for work, he’d have to make a choice that would violate his virtue of Resolution…

Willpower: Rediscovering The Greatest Human Strength – Page 65

Whenever Franklin made progress in one area he would regress in another. He was still stuck in the same Groundhog Day trap! (He did make some net progress though). If Benjamin Franklin couldn’t avoid this trap despite his best efforts, how could anyone?

One might think that modern technology is the answer, but no clear solution has emerged. In fact, many contend that technology has only exacerbated the problem due to constantly interrupting our focus and hijacking our attention. While it is true that technology can be a tool to distract us, it can also be a tool to help us stay on track. Perhaps Franklin failed because his "technology" wasn’t good enough. Could digital journaling, pop psychology, project management theory, and a smartphone have been what Franklin was missing? I was desperate for a way out of the "Groundhog Day trap" and those were the only tools I had. It was worth a shot.

Living in the Distraction Age — Hooked by Nir Eyal

My first job out of college was working primarily in app development at Amazon (Goodreads specifically). I worked on a social reading app and spent much of my free time studying up on making the best apps. Despite being an engineer, I didn’t limit myself to just learning the technology. I also learned about the marketing, economy, and design behind the best apps. Working on a social reading app meant I read a lot, so it was only natural that I came upon the book Hooked by Nir Eyal.

Nir Eyal is an expert in psychology, technology, and design that has taught at Stanford’s Graduate School of Business and has consulted for major companies and publications. In Hooked he applies his expertise to apps and gives his blueprint for making an app that users can’t put down. His blueprint argues that there are 4 steps to getting users consistently engaged. They are:

  1. The Trigger – The Trigger is what makes a user engage with an app. There are two types of triggers: external and internal triggers. External triggers are something like an advertisement or a push notification from an app. Internal triggers come from within and usually correspond to a feeling or emotion. An example of an internal trigger is feeling bored and then opening a News app. Internal triggers are often much more powerful than external ones because they occur constantly throughout the day. Further, internal triggers form the basis for forming habitual behavior on the neurological level. It creates a link between an internal emotion and an app that can “satisfy” that emotion.
  2. The Action – The Action refers to how the app satisfies the trigger. For example, if the trigger was loneliness then your app might offer the action of sending a friend a message. The best actions are simple ones that maximize motivation and ability. That is, users should be sufficiently motivated to complete the action. Further, the app must enable the user to easily complete the action. Much of Twitter’s early success was due to enabling people to easily and quickly share online compared to other services at the time.
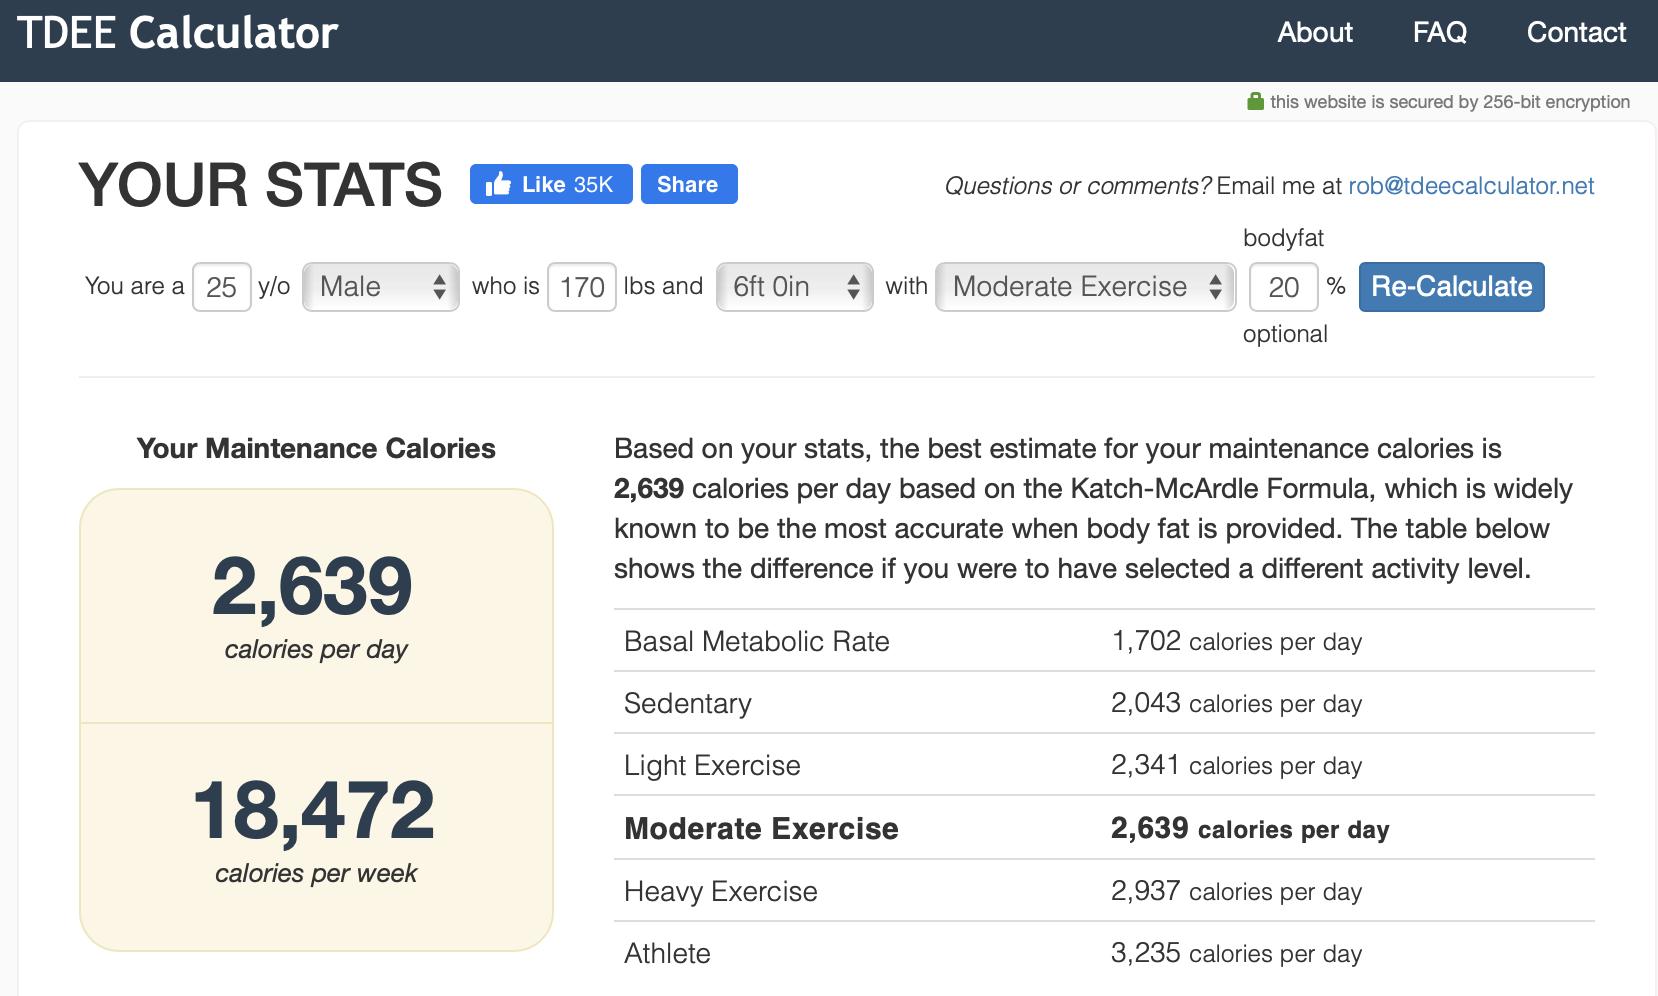
  3. Variable Reward – As a user engages with an app, it is important to reward them. An example of this is a “congratulations” message in diet-tracking app for meeting a calorie goal. One can make particularly engaging apps by offering a variable reward. Variables rewards were famously studied in Skinner’s Pigeon Experiment. He found that pigeons were more inclined to press buttons that dispensed variable amounts of food than constant amounts (even if that variable amount was sometimes less). Even pigeons like gambling! This same principle can be used to make users more likely to engage with an app again. Examples of variable rewards are coins in mobile games or likes on a Facebook post (you don’t know how many you’ll get). Our innate desire to seek out the largest reward will keep us coming back for more. These first three steps: trigger, action, and variable reward build the basis for forming a “habit loop” with an app.
  4. Investment – To ensure that users stick with an app it’s important that the user becomes invested. Consider online social networks such as Facebook. No one is willing to try out another app because they’ve already invested effort in adding friends on Facebook. This keeps users within Facebook’s “habit loop” rather than a competitor’s. Investment is the key to solidifying the “habit loop” created in the first 3 steps.

By applying these 4 steps one can create a truly engrossing app. This would serve as valuable knowledge to me not just as an app developer, but as a consumer.

I began to increasingly notice the "Hook Model" in apps that I used everyday. Instagram’s infinite-scroll discovery feed and Reddit’s karma system were perfect applications of the "Hook Model". I began to realize that I was spending the vast majority of my time engaged in "habit loops" engineered to keep me using an app. In a way, I felt taken advantage of. Was I using those apps because I enjoyed them or was I using them because I was hooked? I took this as an opportunity to delete the vast majority of the apps I had been using. At first it felt a bit strange, even a bit lonely. But as time passed I realized I was much happier. I found myself less distracted and more present in my activities. It was as if a dense fog clouding my mind had been lifted.

That doesn’t mean the "Hook Model" is bad though. The "Hook Model" is simply a tool. It can be used for good purposes and for bad ones – a point that Nir Eyal stresses in Hooked. I decided to try and use the "Hook Model" to help myself. At the time I wanted to get more into journaling. Journaling has been shown to have a variety of benefits with respect to personal growth and mental health. Plus I liked that idea of keeping a record of what I did. I sought out an app that used the "Hook Model" to keep me journaling – Day One.

The Beginning of History — Day One

Day One is a popular digital journaling app. It has a robust feature set that allows for custom typesetting, journal templates, photo entries, geo-tagging, voice notes, video, multi-device syncing, and labels/tags amongst other things. It also has a reminder system to keep you on top of your journaling. When I first started journaling with Day One I was not very successful. My journaling was excellent whenever I took the time to do it, but my problem was that I didn’t do it consistently. To correct this, I took advantage of the reminder and template feature to get myself "hooked" on the app. I set up daily reminders (an external trigger) and created a template for simple, routine daily entries (ease of action). Day One kept me motivated by awarding me with "hot streaks" when I consistently journaled well (variable reward). Finally, Day One started to notify me of historical journal entries. That is, Day One would give me notifications such as "1 year ago you wrote [text]" or "last time you were here you took this photo" (investment in the app). The strategy worked just as Hooked suggested and within a month I was a journaling religiously.

The Day One Journaling App

Journaling was a great exercise in writing and served as a good stress-relief technique. The greatest benefit from journaling, however, was being reminded of past entries and re-reading them. For the first time in my life I was able to easily go back and review my past thoughts and actions. I was able to compare today to yesterday or this month to last month. I was finally witness to my own history. This meant that I might finally have a tool to escape the "Groundhog Day trap". If I meticulously recorded my history, then I could actually know if I was "reliving yesterday". Perhaps if I kept this habit up and incorporated the power of technology, I really could escape the Groundhog Day trap.

A Framework for Growth — The Agile Methodology

Journaling wasn’t the only new system I was incorporating into my life at the time. I was also learning "The Agile System" at my work. Agile refers to a set of techniques used in project management and product development that promotes adaptive planning, continuous improvement, transparency, accuracy, and flexibility. It has historically been used as a framework for developing software, but has since been adapted for many other purposes. While the exact implementation of Agile can vary rather drastically from team to team, the principles are largely the same. Here I’ll explain the implementation of Agile that I know best.

In most versions of Agile work is done in distinct blocks known as a "sprint". Sprints are generally 2-4 weeks in duration and once a duration is picked it is generally kept. Thus, work can be seen as a series of successive sprints. Each sprint follows the same structure. Below I give an example of a 2 week sprint. (Note that I’ve intentionally given a very simplified version of the Agile method here).

2 Week Sprint Outline
Day 1: Sprint Planning

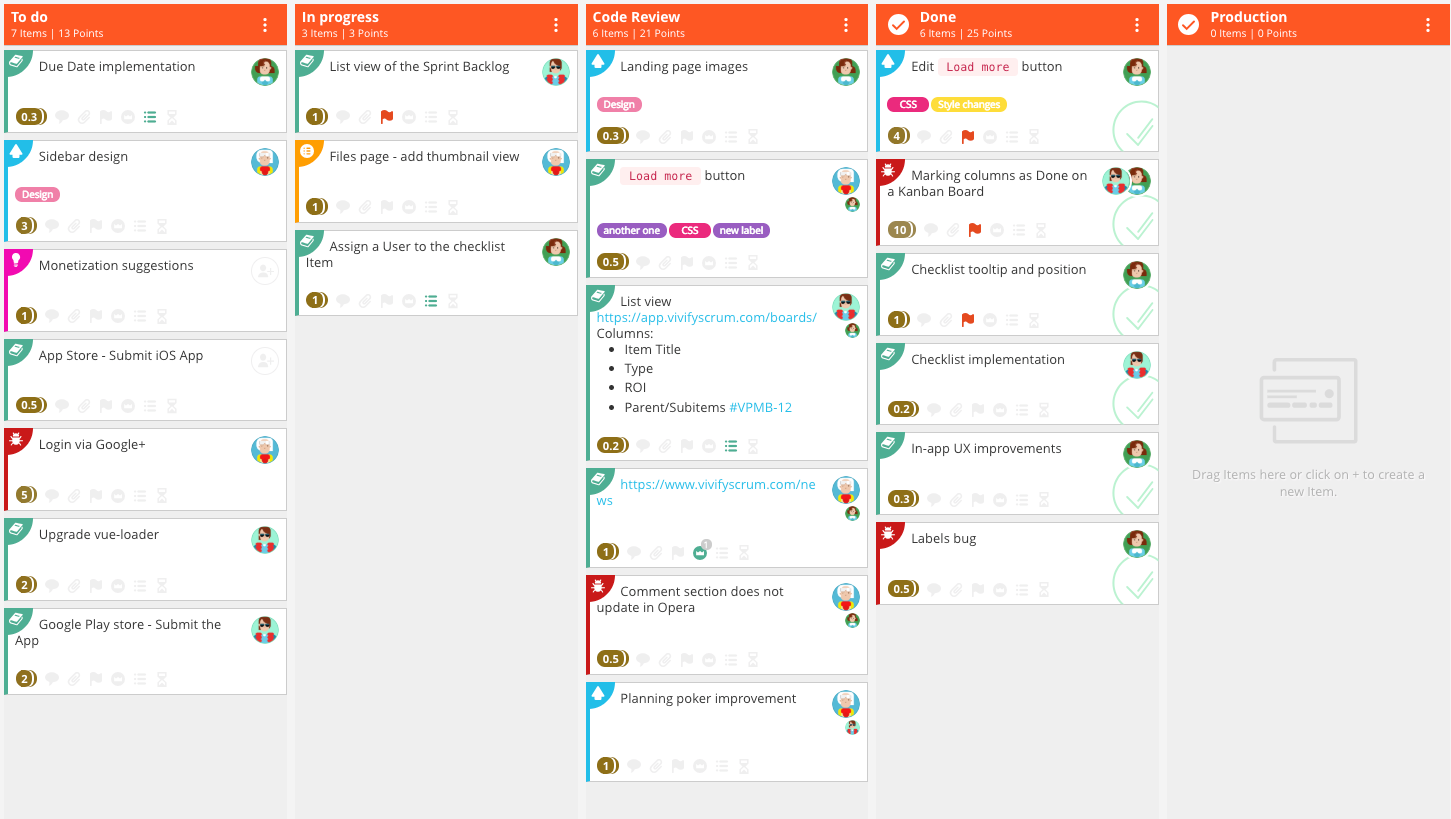
Sprint planning begins by taking high level team goals and breaking them down into concrete tasks. For example, if a team goal is to build an app then one of the concrete tasks might be to build an "about us" page in the app. The next step is to determine the team capacity. A team of 4 engineers that code 5 hours per weekday each and have 3 total vacation days gives a capacity of 197 hours. The tasks from earlier are then assigned time estimates by the engineers. Estimates can be in the form of hours or broader categories that correspond to hours (a "large" task might equal 30 hours). The team now decides which of those tasks can fit in the sprint given its 197 hour capacity. Once a set of tasks is decided upon no other tasks should be added/modified during the sprint. That is, the plan should not be deviated from during the sprint to ensure consistency and progress. Teams often devote an engineer to handle unexpected issues that may occur during the course of the sprint. This engineer’s time is not considered when calculating sprint capacity so that unexpected items do not cause deviations in the outcome of the sprint. Finally, a series of "task cards" are created. These task cards are used to visually track the progress of the sprint and manage information such as to whom a task is assigned.

A Sample “Sprint Board”
Days 2-13: Daily Standup

Standup meetings are held each day for the remainder of the sprint. The purpose of these meetings is to get a brief status report on each item in the sprint and check-in on the overall status of the sprint. The meeting is meant to be quick and effective. It should never take more than 10 minutes and any longer conversations should be taken offline. This is generally done by going through each of the "in-progress" tasks and hearing a brief progress update from whomever is working on the task. A common alternative to this is each team member giving a status update on what they’ve been working on. Finally, the team leader give an overall status report on the sprint to ensure proper coordination amongst outstanding tasks. When done properly these standup meetings help foster better communication and transparency. Further, they help keep the team on track and help the team identify roadblocks early. Lastly, it is important to record the time spent working on each task. This will be important during sprint retrospective later.

Day 14: Sprint Demo

Sprint demo is when all of the work accomplished during the sprint is shown to the team. Engineers can exhibit the new functionality they’ve built, designers can show the latest sketches/mocks they’ve been working on, project managers can show the latest product insights they’ve gained, and so on. The purpose of sprint demo is to give everyone a chance to take pride in their work and show off what they did during the sprint. Also, sharing in a group fosters more collaboration, creates accountability, and serves as a good indicator of the team’s overall progress and direction.

Day 14: Sprint Retrospective

Sprint retrospective gives the team a chance to review, reflect, and iterate on their last sprint. It begins by having team members share "what went well" and "what could be improved" for the sprint that was just completed. Examples include "we caught bugs before shipping to customers" and "we forgot to provide translations for the latest blog post". Things that can be improved upon, such as forgetting to provide translations, are given an action item such as "add translation task to all future sprints". Actions items are then assigned a point person and are reviewed during the next sprint retrospective to make sure they’ve been properly implemented. Finally, the team checks if their time spent on all tasks/tickets actually matches their initial estimate for the sprint’s capacity. The sprints capacity is then adjusted to account for this. For example, if the team only did 4 hours of coding work every day instead of the estimated 5 hours then the next sprint should use 4 hours per day as the basis for estimating coding work. Conducting a sprint retrospective is critical for ensuring that next sprint goes better than the last one. Improvement only happens by addressing and iterating on the missteps from the prior sprint.

Many teams have had great success using the Agile model detailed above. As a result, it is almost ubiquitous amongst software development teams and increasingly common with other types of teams. I came to the same conclusion after implementing and running the Agile model on my team at work. Our team was more efficient, less stressed, and finally making verifiable progress. All of this left me wondering, where else can the Agile model be applied?

How To Hack Yourself — Agile and You

At this point I had been journaling for several months and saw great progress. The techniques I applied from Hooked kept me committed, but I wanted to get more out of journaling. Specifically, I wanted my journaling to help me make progress as a person just as Ben Franklin’s Virtue Journal did for him. Luckily, I already had the answer right in front of me — The Agile Model. What if I implemented the Agile system for myself instead of just my team at work? I could use one week sprints to not just keep track of my life, but also improve my life. The benefits of trying this were immediately clear, namely:

  • I’d have a concrete plan for what I wanted to achieve each week
  • I’d end up with a detailed account of everything I had done each day and each sprint
  • I’d continually improve my process during each week’s retrospective and thus increase my rate of progress each sprint

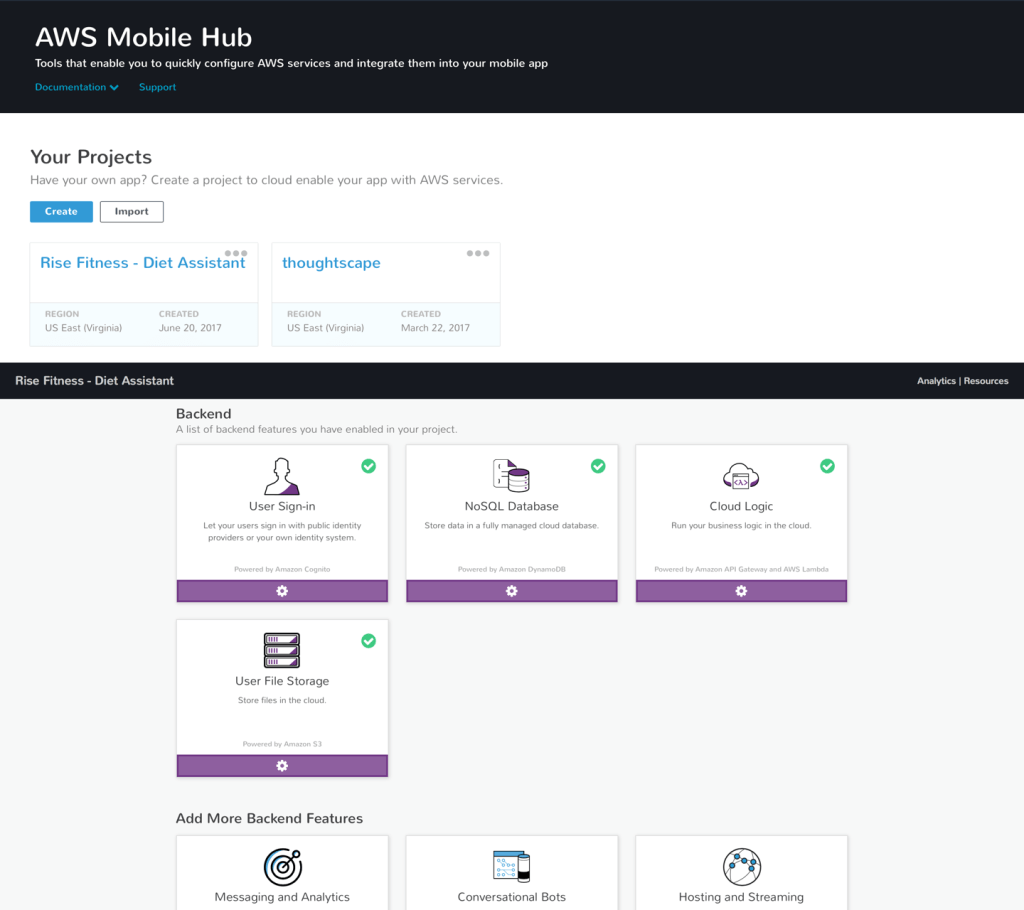
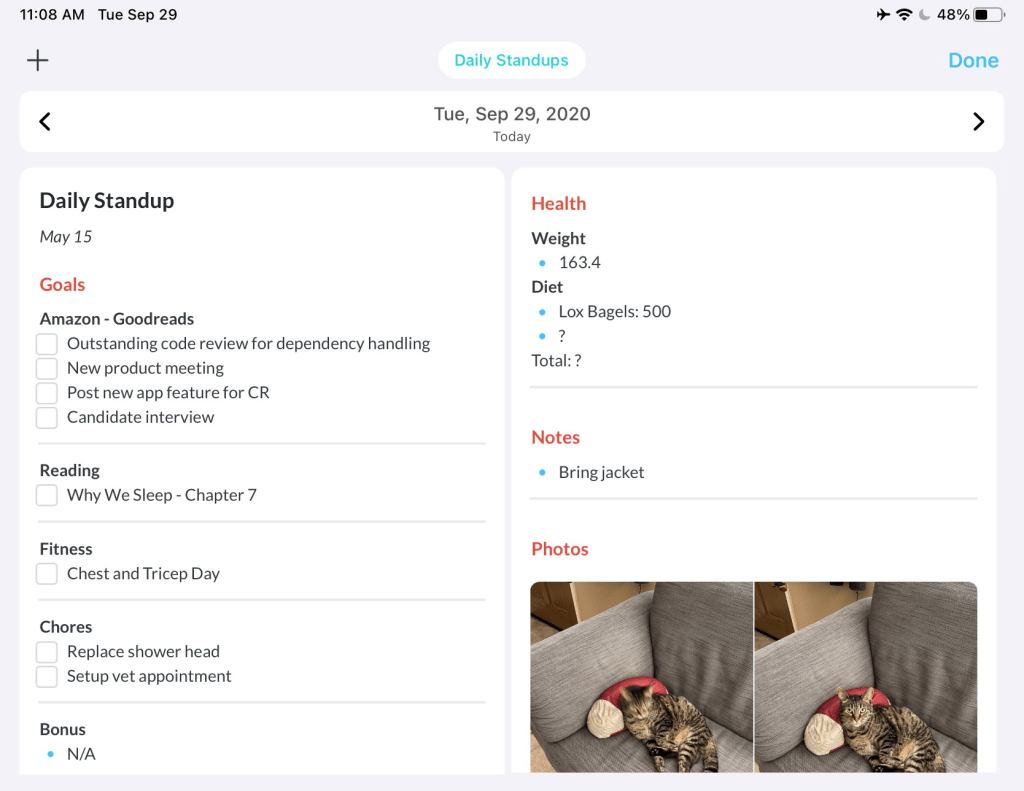
Day One was the perfect app for implementing my personal Agile model. Their template feature allowed me to create templates for sprint planning, daily standup, sprint demo, and sprint retrospective. Every Sunday I would conduct a sprint planning session for the week and lay out my high level goals as a function of my capacity. Each weekday I would have a daily standup and review the smaller tasks that I needed to complete. Finally, on Saturday I would conduct a sprint demo and retrospective. I’d go over what I had achieved during the sprint and then make improvements to my process to make the next sprint go even better. Below are some examples of my initial system:

Personal Daily Standup Example Using Day One
Personal Sprint Retrospective Example Using Day One

Over the next year I used and improved my "Personal Agile Model". It was a huge success almost immediately and one of the most impactful life changes I had ever made. It seemed like I had finally found a true solution to the Groundhog Day trap. By keeping a record of my life I was able to actually compare today to yesterday. Further, by constantly working to improve my life I could ensure that today was better, and therefore different, than yesterday.

The Limiting Factor — Mental Health

For a while it seemed like I had escaped the Groundhog Day trap. Each day was (generally) better than the prior. I was able to see and feel my life improving in real time. Unfortunately, after the first year my progress began to plateau and I hit a wall. Whenever I made progress in one area, I began to falter in another. I had ran into the same issue as Benjamin Franklin did with his Virtue Journal. Luckily, all of the data I needed to solve this problem was literally right in front me — my journal.

I reviewed all of my sprints and journal entries and a few key suspects emerged. They were:

  • Distractions by technology (Reddit, instant messaging, etc)
  • Lack of focus and stress due to intrusive thoughts (worry or anxiety, such as “Oh, will we still meet that project milestone?”)
  • Tiredness from doing too much work and feeling “burnt out”

The common thread between all of these was "the mind". I wasn’t running up against physical limitations such as my health. (I had already hacked my physical health in previous projects here and here). It seemed my limiting factor was mental health. In order to investigate further I read The Disordered Mind by Eric Kandel.

Mental health has historically been an elusive and less concrete concept than physical health. This makes sense intuitively. If someone is having trouble walking and has a large bruise/bump on their leg, then it’s obvious what’s causing the problem. If someone is depressed, however, it’s not so easy to look inside their brain and point to a clear reason why. It’s often easier to believe the cause is a "poor attitude" or "lack of motivation". The truth is that the biological underpinnings of mental health are far more complicated than physical health and we still don’t completely understand them. However, for the first time in history we are finally getting close. In fact, with each advancement we are realizing that mental health is no different than physical health. Consider the following example explaining the biology and chemistry behind the symptoms associated with recurring stress:

Excessive concentrations of cortisol destroy synaptic connections between neurons in the hippocampus, the region of the brain that is important in memory storage, and neurons in the prefrontal cortex, which regulates a person’s will to live and influences a person’s decision making and memory storage. The breakdown of synaptic connections in these regions leads to the flattening of emotion and to the impaired memory and concentration that accompany major depression and chronic stress.

The Disordered Mind: What Unusual Brains Tell Us About Ourselves – Loc 960

Now that we have begun to understand the science behind our minds, we can finally start to use technology to aid the mind. Science fiction predicts some bizarre futures. Psychopass predicts a dystopian future where the government will use mental wellness exams to keep us in check. The Dark Forest predicts we will develop technology to help motivate us and mold our feelings. Actual science shows we may not be too far off from a machine to treat depression:

Mayberg was familiar with these advances and thought that slowing the firing rate of neurons in area 25 might relieve the symptoms of depression. She used deep-brain stimulation in the anterior insula region to treat twenty-five people whose depression was resistant to treatment. She collaborated with a team of neurosurgeons, first at the University of Toronto and then at Emory, who implanted the electrodes. When she turned on the electricity in the operating room, she saw almost immediate changes in the patients’ mood. The patients no longer felt the unending psychic pain characteristic of depression. Moreover, the other symptoms of depression gradually lifted as well. People recovered and were stabilized for the long term.

The Disordered Mind: What Unusual Brains Tell Us About Ourselves – Loc 1192

While we aren’t quite at the point of rewiring our own brains yet, we do know enough to start applying some basic mental hygiene to keep our minds healthy.

How To Not Burn Out — Headspace and Mental Runbooks

On Friday June 8 of 2018 I was traveling to Chicago to explore the city and attend my brother’s graduation. As my flight was about to take off, I got a text that Anthony Bourdain had died by suicide. Stunned, I googled the news just to be informed that the Wi-Fi on the TV-less flight wasn’t working. I sat there, bored and disconnected, wondering about the news. How could that happen to someone that had turned their life around and inspired countless others (such as myself) to travel? While I could never answer that specific question, I could think of how to prevent similar things from happening in the future. How could I use technology and my research on mental health to prevent something like this?

I began to sketch out an app on the flight called "Mental Runbooks". A Runbook is typically an engineering manual on what to do when something goes wrong in a system. For example, there might be a section on "what to do if power is lost" or "how to manually reboot the system". The idea is that during a stressful scenario people will not act rationally. Therefore, one should be prepared by writing out what to do ahead of time so that in the case of an emergency all one has to do is follow a simple series of steps. I wanted to apply this same concept for common mental health situations such as experiencing anxiety, intense procrastination, negative thoughts, etc. My theory was that perhaps if Bourdain had such a tool he’d still be here today.

Prototype of “Mental Runbooks” from June 8, 2018 Flight

Over the next few months I read up on and learned a variety of techniques for keeping one’s mental health in check. Most of the techniques were small tricks such as physically removing distractions like smartphones, creating boundaries between work/home, noting and acknowledging intrusive thoughts in order to resolve them, etc. Some of them were broader concepts though, such as presence — being fully engaged in the current moment.

One particularly useful tool I discovered during my research was Headspace. Headspace is an app that uses guided meditation to help users be more present. The theory is that meditation serves as practice for being present. When one meditates they must clear their mind and focus solely on their breathing. This is in essence being present. Thus, by practicing meditation one can "train" their ability to be present. Headspace encourages applying the same principle when engaging in other activities. For example, when typing an email one’s attention should be on just that. When the mind strays to an intrusive thought or a notification from an app, one must simply recollect themselves and return their focus to the task at hand.

Presence is an extremely powerful concept because it can shield against distractions and anxiety. By routinely clearing the mind and striving to maintain focus, one becomes aware of pestering distractions like social media. Further, one can get a leg up on anxiety by being aware of intrusive thoughts and avoiding getting sucked into them.

By this point I had learned a ton about mental health, but hadn’t made much progress on my Mental Runbooks app. I simply didn’t have the time to build it. Nonetheless, I did want to incorporate the lessons I learned about mental health into my "Personal Agile System" and overcome my progress plateau. The problem was that I wasn’t sure how to do it. Incorporating headspace and some other tips and tricks was helpful – but not enough to take my "system" to the next level. I had all of the right ideas behind what I wanted, but I couldn’t put a name to it.

Coming Full Circle — Indistractable

In October 2019 Nir Eyal, the author of Hooked, came out with a book titled Indistractable. Prior to the book’s release, he spoke to my organization at work. He told us a brief story that inspired him to write the book. He also recounts it at the start of the book:

“Daddy,” she said, “what would your superpower be?”

“Huh?” I grunted. “Just a second. I just need to respond to this one thing.” I dismissed her as I attended to something on my phone. My eyes were still glued to my screen, fingers tapping away at something that seemed important at the time but could definitely have waited. She went quiet. By the time I looked up, she was gone.

I had just blown a magical moment with my daughter because something on my phone had grabbed my attention. On its own, it was no big deal. But if I told you this was an isolated incident, I’d be lying. This same scene had played out countless times before.

Indistractable: How to Control Your Attention and Choose Your Life – Page 5

In an ironic turn of events, Nir Eyal had become victim to the exact same techniques he had popularized in Hooked. Nir Eyal’s experience had in a way mirrored my own. Over time I had come to realize the dangers of modern app design and the importance of mental health. And much like Nir Eyal, I had come up with a personal system to deal with said issues. Nir Eyal, however, had come up with a name for the system I was trying to put together. I was trying to be indistractable. That was what I needed to be if I wanted my system to work and to escape the Groundhog Day trap.

In Indistractable Nir Eyal lays out his take on what one needs to do to become indistractable. The first step is defining a set guiding goals/areas-of-focus. This should include everything in one’s life — career goals, family, and personal activities. A simple example might be: career, wife, puppy, swimming, and video games. It’s critical that one identifies what is important to them before deciding how to spend their time/focus. Once that is done, it becomes possible to define traction and distraction. Traction refers to actions that move us towards what we really want (our goals, responsibilities, etc.). Distraction refers to activities that don’t. We tend towards traction or distraction based on external and internal triggers. Nir Eyal’s "Indistractable Model" provides a framework for optimizing for traction. The model has four key tenets:

  1. Master Internal Triggers: The first step to mastering internal triggers is to identify what they are. This can be done by looking for the discomfort that precedes the distraction. For example, if one opens a gaming app when stressed, then the internal trigger is likely that type of stress. Once an internal trigger has been identified it is important to keep an eye out for them. Often the difference between succumbing to such a trigger or not is knowing how to identify a triggering moment. One common technique to avoid internal triggers is “surfing the urge” whereby one promises to try and make it “5 more minutes” before succumbing to a trigger. More frequently than not one lasts the 5 minutes and can then do 5 more. Another technique is reframing the task. Instead of simply trying to accomplish the task, try and find a more efficient way to do it. Play games and use tricks from Hooked to make the task fun and avoid common internal triggers. Lastly, acknowledge that succumbing to some internal triggers is inevitable. The goal isn’t completely avoiding distraction; it is minimizing distraction.
  2. Make Time for Traction: In order for an activity to count as “traction” it must tie back to a guiding goal/area-of-focus. Thus to maximize traction, one should make sure most of their time can be tied back to those guiding goals/areas-of-focus. The best way to do this is by creating a timeboxed schedule. This means dividing each chunk of the day into 15 minute to 1 hour blocks of focused activities. Keep in mind that activities like friends, relaxing, and chores should be areas-of-focus and therefore be timeboxed activities. Even activities like playing games or watching tv are included — just make sure to not give them more time than necessary. Timeboxing our schedule forces us to be wise and intentional about how we spend our time. Additional techniques such as maintaining clear boundaries between “work time” and “family time” can make this practice easier. Don’t forget to plan timeboxes with family, friends, and coworkers so that expectations are balanced and transparent.
  3. Hack Back External Triggers: External triggers such as smart devices, app notifications, and television screens often impact our ability to stay on focused during a timebox. When executing a timebox it is best to remove any potential external triggers that do not serve the timebox’s objective. External triggers can be identified in real time by asking oneself, “Is this trigger serving me or am I serving it?” Often external triggers are in the form of other people that interrupt. This can be mitigated by explicitly scheduling time for focused work and time for meeting with others. Having “office hours” is a clear sign to colleagues that there are proper and improper times to interrupt. Additional techniques include explicitly marking oneself as focused by wearing headphones and turning on “do not disturb”. The book offers a variety of specific techniques for common traps such as email, group chats, meetings, and smartphones.
  4. Prevents Distraction with Pacts: In the Odyssey Odysseus avoids the irresistible temptation of the Sirens by having his crew tie him to his ship’s mast. He tells his crew to not release him despite all of his pleas until they had passed the Sirens. This type of action is known as an “precommitment” pact. The fundamental principle is to configure a future situation so that one can’t avoid doing the right thing. That is, make a plan that can’t fail. There are three common forms of precommitment pacts that aid with preventing distraction. Effort pacts work by making an unwanted behavior more difficult to engage in. A famous example of this is the kSafe. The kSafe is a locking container that can’t be opened (other than by breaking it) for a set period of time. Price pacts involve putting money on the line to encourage one to do the right thing. An example of this is betting a friend that you’ll get a task done. Price pacts are a good tool, but are most effective when used infrequently. Lastly, identity pacts work by having one adopt an identity that inspires themselves to be better. For example, labeling oneself as a “vegetarian” provides encouragement to avoid meat. Studies have shown that a person is far more likely to engage in an action when it is an expression of self rather than a rote behavior.

Many of these strategies were very similar to the ones I had discovered. Armed with the "Indistractable Model" and my own experiences I sought to create a holistic app for productivity, focus, mental health, planning, etc. I wanted to create the ultimate tool for escaping the Groundhog Day trap permanently.

Building Fast and Lean — SwiftUI

I wanted to break my progress plateau and escape the Groundhog Day trap quickly. This meant I needed a simple but powerful tool to build my "ultimate app". Luckily, SwiftUI had just been released by Apple and was finally being picked up by developers. SwiftUI is a robust framework for building declarative user interfaces. Its elegant design allows for clear and concise code to be written quickly. Further, it automatically works on all Apple platforms and integrates with existing Apple technologies. SwiftUI differs from traditional UI programming by combining the code for the "view" and the "controllers" that power the view. Instead of managing all of the interactions between the view, controllers, and underlying data, the programmer simply declares how the view and controllers should operate as a function of the data. The underlying data serves as a "single source of truth" from which the rest of the state of the app is derived. The code is so clear that you arguably don’t even need any experience to understand it:

A SwiftUI App Displaying a Signup Button to a User

SwiftUI allowed me to quickly build out all of the visuals, logic, and functionality behind my app. My only remaining choice was how I wanted to store and represent the underlying data.

I chose to use Core Data to persist my app’s data. Core Data is a built-in Apple tool for storing data. It provides a ton of functionality such as large-scale storing of a variety of types of data (even photos), background data tasks, undo/redo operations, and integrations with other Apple tools such as iCloud syncing. It also interfaces well with SwiftUI through simple "fetch requests". Lastly, all of the data is stored locally and doesn’t require any internet to use. Thus it is both secure and private.

I was able to use SwiftUI and Core Data to quickly and elegantly build my app without cutting any corners.

Making A Plan — The Weekly

I began building my app by combining the sprint planning step of my Personal Agile Model with the goals and areas-of-focus that form the basis for the Indistractable Model. As such, the first step in the app is the weekly planning phase whereby a user establishes their areas-of-focus for the week and corresponding high-level goals. This process is demonstrated below in the segment of the app known as "The Weekly":

Demo of Planning Using “The Weekly”

Once weekly goals and areas-of-focus have been setup, the user begins their weekly "sprint" and starts using the other modules within the app (such as daily standup and timeboxes). Throughout the course of the sprint the user can come back to The Weekly and mark goals as completed. Once the sprint is complete, the user returns to The Weekly to do their sprint retrospective. This allows the user to reflect on what went well, what went poorly, and what to improve for their next sprint. This cycle of reflection, iteration, and improvement is key to ensuring growth week over week. This can be seen below:

Demo of Sprint Retrospective Using “The Weekly”

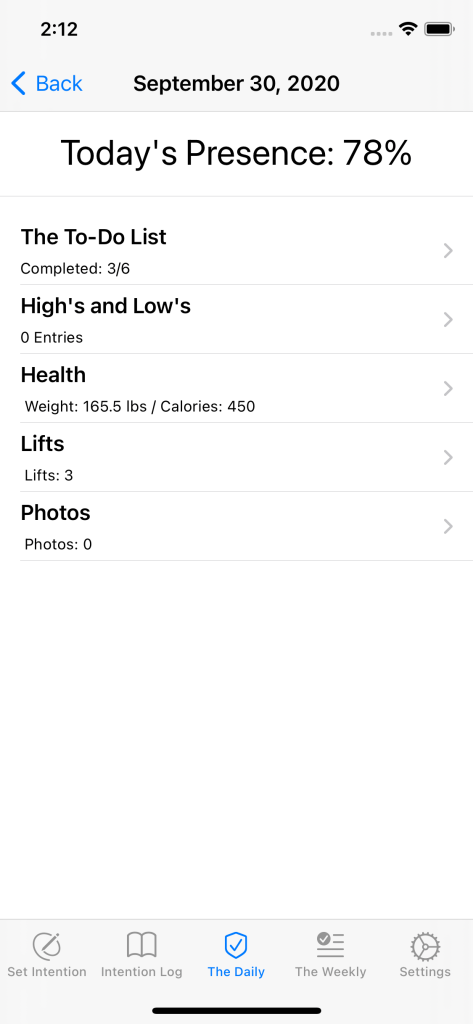
Staying on Track — The Daily

Once the weekly sprint has been setup, each day of the week is managed through "The Daily" segment of the app. Within The Daily users setup and manage their daily to-do list. All to-do’s must tie back to the original goals/areas-of-focus setup in The Weekly. This forces the user to the be cognizant of engaging in any tasks that deviate from their intended weekly plan. This list of to-do’s also serves as the basis for the daily standup whereby the user reviews their work plan for the day. This is demonstrated below:

Demo of Daily Standup and To-Do List Using “The Daily”

The Daily also offers others modules in addition to the to-do list. These custom modules provide detailed tracking/reporting for special activities. Currently the app supports additional tracking/reporting for health, sleep, workouts, daily review, and photos. These additional modules help users keep other important daily activities in check. The goal is to ensure a solid foundation for productivity by optimizing for physical health, self-reflection, sleep, mental health, etc. Often the reason for plateauing or hitting a wall is lacking that strong foundation. Some of these modules are demoed below:

Demo of Custom Modules Using “The Daily”

Being Present — The Intention Log

The primary feature of the app is "The Intention Log". The Intention Log is a process for conducting focused work and being present. The process works as follows:

  1. Set An Intention: The user begins by defining an “intention”. An intention is a clear and concise activity that the user plans on engaging in. Examples include: getting showered/dressed, emailing direct reports, edit TPS reports, bathe cat, etc. By explicitly setting an intention, the user can know whether or not they are staying focused. More often than not we fall into distraction traps because we never explicitly decided on what we wanted to do in the first place. Once an intention and duration is decided upon, the user proceeds to the next step.
  2. Execute The Intention: The user is then presented with a screen that reiterates the planned intention and shows a countdown timer based on the set duration. The user is reminded to remove external distractions and of other useful tips/tricks from Indistractable. The phone is automatically set to “do not disturb” and a notification is only sent once the duration has finished. The purpose of this step is to create a “bubble of presence” whereby the user will not be distracted by external triggers or get trapped in intrusive thoughts. Within this bubble of focus users can engage fully in their planned intention. It is meant to be no different than meditation — one’s mind should be completely focused on the intention to make time for traction.
  3. Tag The Intention: The user then adds tags to the intention from a list of common labels. This is useful for future analytics and record keeping. It also forces the user to consider how their intention ties back to their goals/areas-of-focus and whether they are engaging in traction or distraction.
  4. Rate The Intention: After tagging the intention the user indicates how they felt during the intention: ecstatic, happy, meh, sad, or angry. The user must wait 5 seconds before making a choice. This forces the user to really reflect on the intention and how it made them feel. Understanding and being in-tune with one’s emotional state helps the user manage their mental health and select future intentions in a productive way. Further, this feeling data can be used along with tag data to draw important conclusions. For example a user can use this data to learn what activities bring them joy and what activities cause frustration. This information can then be used to plan intentions in a way that leads to better outcomes.
  5. Review The Intention: Finally, the user conducts a more formal review of the intention. They are prompted to answer “what went well?”, “what could be improved?”, and “what was interesting?”. This process is very similar to the sprint retrospective process, but applied to each intention. By reflecting and making corresponding adjustments, we setup ourselves up for more success in the future. Constantly reviewing and reflecting on our actions forces us to be more in-tune with our lives and more present. It stops us from sleepwalking through life due to distracting technology or other mental health issues.

Lastly, users are given notifications throughout the day if they have failed to complete/review an intention or have yet to start an intention after a while. A full demo of this is shown below:

Demo of “The Intention Log” Process

Users can easily go back and review/edit past intentions as demonstrated below:

Demo of Reviewing/Editing “The Intention Log”

Lastly, users can track the percentage of their day spent "present" within The Daily:

The “Presence” Metric

I never managed to come up with a good name or logo for the app and ended up just calling it "The System". Despite not having a finished app name, I was finally done with it and ready to start using it. It was time to escape the Groundhog Day trap forever.

The Ultimate Stress Test — Coronavirus and The System

I was using my new app and doing excellently. I had blown past my old plateaus and was making good progress. Everything was going great… and then Coronavirus struck. It was the ultimate irony. I had spent years building a system to escape the Groundhog Day trap just to be thrown into a global catastrophe that basically required the world to live like a groundhog during winter in order to survive. Good luck making today different than yesterday when most things are shutdown, social contact is severely limited, and all work is done remotely (not to mention being literally trapped indoors during the ensuing California Wildfires).

Despite all of this, I’ve managed to not just survive but thrive. "The System" was exactly the tool I needed for all of this. It kept me on track, maintained my mental health, ensured I made progress, and helped me escape the many pitfalls associated with life during Coronavirus. By making weekly/daily plans and being completely present during my intentions I was able to largely escape the mental anguish that has affected so many during this pandemic. The System really did live up to my original vision. I was able to intelligently use technology, psychology, design, and science to escape the Groundhog Day trap — even during one of the most difficult times in modern history. I got past Benjamin Franklin’s problem of making progress in some areas just to falter in others by continually honing The System. It was finally time to stop reliving yesterday and embark upon today.

Where We Are and Where We’re Going

I’ve continued to make improvements to The System since completing it. I have, however, taken a break from putting all of my spare time into it. I want to let The System run for a while and see how it does before making any more significant changes. Nonetheless there are many things that I would like to do. I would like to make a final version of this product and put it on the App Store for everyone to be able to use and benefit from. This should be relatively easy because it has no 3rd party or online dependencies. Other ideas include:

  • Reporting of common metrics during sprint retrospective
  • Suggestions based on past activity using AI/ML
  • Building additional features to boost engagement and presence

I’ve included a final holistic demo below:


Categories
code fitness

Rise Fitness – Building A Better Diet Tracking App

Getting Fitter — The Start

Everyone knows the hackneyed trope "you are what you eat." There’s not much debate over whether the phrase is true or not. It’s largely accepted as fact. But if we all know this, then why are so many of us so unhealthy? Two thirds of all Americans have been obese at some point in their life and almost half are right now.¹ Obesity related health issues are costing us hundreds of billions of dollars and millions of lives.² While there is no single cause or solution for this, one obvious (partial) answer is a simple addendum to that hackneyed trope: "you are what you eat and how much."

I first started to care about what I ate, and how much, when I started lifting weights in college. I kept training and practicing, but I wasn’t getting much stronger. Eventually I determined that my limiting factor was muscle mass. I needed to put on more muscle and to do that I needed to eat more. I tried and struggled to eat enough and didn’t see much progress. Having majored in physics up to that point, I knew that the First Law of Thermodynamics explained that energy is conserved in a closed system. If I let my body be the closed system while having energy entering the system be food consumption and energy exiting the system be bodily activity, then I could model my mass (recall energy is mass). My mass would change according to whether more food entered my body or more bodily activity was done. Specifically, I could control my weight fairly accurately day-by-day using: Calories Consumed - Calories Burned = Leftover Calories. If my Leftover Calories were positive for a day, then I must be gaining weight because I’m consuming more than I’m burning. Likewise, if it was negative then I must be losing weight because I’m burning more calories than I’m consuming. In order to do take advantage of this equation I needed a way to log how many calories I consumed and burned each day. Thus began my journey into diet tracking.

Beginner’s Luck — MyFitnessPal and TDEE

The first step was determining how many calories I burned and how many I consumed. In 2014 there weren’t many great ways for the average person to track calories burned precisely. However, there were some simple formulas that had proven to be fairly effective. After a little bit of googling I settled on calculating my Total Daily Energy Expenditure (TDEE). This is a simple estimate based on one’s average daily activity level and the calories they burn from that along with their Basal Metabolic Rate (BMR). One’s BMR accounts for the calories one burns from just living (such as breathing and other basic bodily functions) without any additional activity or movement. This can be estimated given several body measurements, such as weight and height. Most TDEE calculators are improved further using other information such as the thermic effect of food eaten. Give it a try yourself here.

Example TDEE Calculator

That gave me the Calories Burned portion of my equation. The last thing I needed was the calories I had consumed in a given day. The obvious solution was to count my calories. Luckily, there was a well-known app called MyFitnessPal that I used. MyFitnessPal allowed me to scan barcodes and enter foods by name and log them against a daily calorie limit. Thus, I could calculate my daily Calories Consumed. And there I had it, both parts of the equation.

The MyFitnessPal App

Armed with this knowledge I was able to easily determine how many calories I had to eat to gain or lose weight. I struggled at first to properly use MyFitnessPal. In a college dining hall there aren’t any barcodes, nutrition facts, or food scales. However, with a bit of struggle I found a few good techniques. I was able to get pretty good at estimating portion sizes with a bit of practice (try this position size estimator out for practice). I was also able to find most food items in the app after a bit of searching around. After several months I had managed to put on almost 20 pounds. It was a success… for now.

Peaks and Troughs — LifeSum and Apple Watch

My fitness journey didn’t end after I gained those 20 pounds. In fact, it had just begun. Over the next two years I continued to track my daily calorie intake and expenditure. I also continued powerlifting, running, and cycling to improve my physical fitness. It was at around this point that the system I had built using MyFitnessPal and TDEE started to fall apart. The first problem I had was with TDEE. Most versions of TDEE estimate a single daily calorie expenditure. This can be accurate for non-athletes and people that do not have much variation in their daily activity levels. However, this models breaks down when engaging in specific bouts of intense physical activity. For example, on my cycling days I’d easily burn over 1000 calories. On the other hand, on a rest day I’d only burn a small fraction of that. This meant that my calorie goal wasn’t accurate day-to-day. On cycling days I’d end up under-eating because my TDEE would be lower than the number of calories I burned. On rest days I’d end up over-eating because my TDEE would be higher than the number of calories I burned (because I didn’t work out that day).

I needed a way to track my calories burned due to activity on a day-by-day basis. Luckily, I was able to find something even better. I got an Apple Watch Series 2 (Nike+ Edition) that tracked my calories burned due to activity minute-by-minute (it also tracked my BMR minute-by-miute). The Apple Watch uses a variety of biometric data to determine in real-time how many calories you’ve expended while just being at rest and while being active. This is known as your Resting Calories and Active Calories, respectively. I was able to use these two statistics to accurately figure out how many calories I was actually burning each day. Namely, Calories Burned = Resting Calories + Active Calories.

The Apple Watch Activity App

Unfortunately, my Apple Watch only solved half of my problem. My other problem was MyFitnessPal. It was getting pretty annoying keeping track of Calories Consumed and Calories Burned separately. I wanted a one-stop-shop where I could view my daily Leftover Calories in the same place where I viewed my Calories Consumed and Calories Burned. I found an app that did exactly this — LifeSum. LifeSum worked exactly like MyFitnessPal (albeit with a smaller selection of foods to log), except it would also sync with my Apple Watch. This allowed me to actually manage and view my total calories consumed, burned, and leftover all in one place.

We Have A Problem — Rise Fitness

My new system using LifeSum and Apple Watch was definitely an improvement, but it still wasn’t quite perfect. The first issue I had was the Apple Watch/Health integration with LifeSum. The integration didn’t work most of the time. The LifeSum app was not using my Resting Calories plus Active Calories to determine Calories Burned, but instead a combination of Active Calories plus additional calories burned for each exercise I did (you can log individual workouts using your Apple Watch). I’m not totally sure why their accounting system was so off or the details of its implementation that made it that way, but I regularly had incorrect activity totals. For example, after a bike ride it had told me I burned 3000 calories (1800 due to ‘activity’ and 1200 due to ‘biking’). The value was clearly wrong because it was double counting the bike ride by polling for the exercise calories plus the cummulative active energy calories. Regardless, it didn’t work for me and I couldn’t find any other app that accurately integrated with Apple Watch data and contained sufficient nutrition information.

That wasn’t my only issue. As I began to read and learn about nutrition it became apparent that most of the diet tracking apps on the market were missing the mark. The first issue was accuracy. The vast majority of items in most apps’ food databases were entered manually by regular users. Further, the catalog of food items was not curated nor checked for accuracy. As a result, many of the stats were objectively incorrect. For example, consider the top two results when searching ‘carrot’ on MyFitnessPal.

Discrepancies in Nutrition Facts in Popular Apps

As one can see, despite both being ‘verified’ there must be someting wrong with at least one because they don’t match. The results get increasingly incorrect for less common food and especially for meats. Another common issue was a lack of specificity. There is a big difference between ‘cooked carrots’ and ‘raw carrots’. It has been shown cooking fruits and vegetables drastically reduces their Vitamin C content (note: this doesn’t mean you shouldn’t cook your fruits and veggies; in fact cooking can often bring out other antioxidants such as lycopene in cooked tomatoes).³ Similar logic applies to cooking meats in different ways (frying in oil versus braising can produce drastically different nutrition values for example). The vast majority of apps do not have entries to account for this and do not make this difference clear to their users. The impacts of this could be significant. Imagine a user that is tracking their daily levels of Vitamin C to meet a health-related goal. If the user is eating steamed carrots all day, but is just using the default ‘carrot’ entry that is shown in most apps, then there will be a big difference between their expected and actual Vitamin C intake. Their app will report a large Vitamin C intake, whereas in reality it will be much less because cooking the carrots reduces the amount of Vitamin C.

By this time I had been monitoring my calorie intake for over 3 years, but still didn’t have an all-in-one solution to visualizing/tracking the simple equation: Calories Consumed - Calories Burned = Leftover Calories. It was at this point that I finally threw in the towel and decided to try my hand at building my own version.

Building Fast — AWS Mobile Hub

I wanted to build this app fast, but I also wanted to get some practice with AWS services. Normally these two things don’t go together; if you want to build an app fast, then worrying about scaling to millions on AWS is probably overkill. Nonetheless, I wanted to do both for for educational purposes. Luckily, there was a simple solution: AWS Mobile Hub. AWS Mobile Hub is a one-stop-shop for all of the core AWS services that one may want to integrate into their mobile app. AWS Mobile Hub works as follows. AWS Mobile Hub is broken up into a list of projects. Each project corresponds to a mobile app. Note that a project can be made for an existing app or for a new app. When inside a project view, one is presented with a variety of different feature options that can be integrated item-by-item into an app. Within each feature option are instructions on how to configure the feature and integrate it into your mobile app. Integration is easy because each feature has an entire sample project demonstrating its usage. In addition, all of the code you’ll need for your feature is generated for you in 4 different languages (Objective-C, Swift, Java, and Javascript). All of the "busywork" (such as setting up your own DynamoDB instance or alarming/logging) is completely taken care of behind the scenes. This reduces the chance of errors during setup, as well as time wasted on tedious setup steps.

AWS MobileHub Console

For this project I primarily used DynamoDB and Email Sign-in/Sign-up, although I have since used just about every feature offered and have had a good experience with most. Integrating both features was quick and straight-forward. I was able to quickly setup relevant DynamoDB tables using the AWS MobileHub Web UI. I was then able to easily use them in my app by using my cusotmized AWS Mobile Hub sample application as a reference. Email Sign-in/Sign-up integration was even easier. I specified a few default preferences and then AWS setup all of the necessary resources and generated all of the code to integrate the feature into my app. All it took was tweaking a few values and some copy-pasting and I was all setup in under an hour (my backend, auth, and sign-up/login portal). Thus, I was able to setup most of the details of my AWS-scale backend in one quick session.

Building Features Using AWS MobileHub

Dot The I’s and Cross The T’s — Apple HealthKit

AWS Mobile Hub helped me setup the infrastructure to build my app, but now I needed to work on building out the features necessary to track my activity and diet. I started with tracking my activity. Naturally, I choose to do this using Apple HealthKit and Apple Watch. Developers can access the data that the Apple Watch passively tracks with Apple HealthKit (check it out here). The Apple HealthKit API was suprisingly easy to use and left me wondering why so many apps get health-related calculations wrong. The two values I was interested in were HKQuantityTypeIdentifierActiveEnergyBurned and HKQuantityTypeIdentifierBasalEnergyBurned (note that this is exactly the Active Calories and Resting Calories mentioned earlier). I was able to compute Active Calories by simply querying for the HKQuantityTypeIdentifierActiveEnergyBurned total over the course of a day. I decided to compute the typical Resting Calories one would burn on a given day using a 30 prior-day average of the HKQuantityTypeIdentifierBasalEnergyBurned. I took a 30 day average in order to get an accurate and balanced value for Resting Calories. A person generally burns the same amount of Resting Calories each day over a month because the energy it takes to simply ‘stay alive’ each day doesn’t vary much outside of dramatic body changes (significant weight loss/gain, a medical condition, etc). Thus I could determine an accurate daily Calories Burned according to Calories Burned = Actives Calories + Resting Calories. Specifically Calories Burned = [today's HK...ActiveEnergyBurned] + [30 day average of HK...BasalEnergyBurned]. All that was left was determining the Calories Consumed and I could completely model my mass.

Diamond in The Rough — USDA Food Composition Databases

Now it was time for the hard part. I needed a way to log everything I had eaten in a given day and tally up the corresponding calorie and nutrition data. I immediately had difficulty finding any kind of nutrition database that was accurate and comprehensive. MyFitnessPal and others had their food databases built up overtime through user submissions. There were several free (and paid) resources for querying nutrition data, but they were all either highly inaccurate or not available to a sole developer. Luckily, I was able to find one good source of information: the USDA Food Composition Databases (browse the databases yourself here).

The USDA Food Composition Database has accurate, verified nutrition data for almost 10,000 different food items. The database contains far more information than the typical nutrition label, including better breakdowns of fats and micronutrients. There were two problems with the database though. First, the database largely only contained ‘base’ ingredients (meats, grains, veggies, etc.) and lacked a great deal of processed or "finished: food ("finished" here refers to completed meals such as Chicken Alfredo). This was not much of a problem for me because I tried to stay away from any processed food. Plus I had planned on making a ‘recipe builder’ feature that could be used to create more complicated meals (such as Chicken Fajitas) out of simple base ingredients. Second, every item in the database was lacking a human-readable label. For example, the entry for 2% milk is: 01174, Milk, reduced fat, fluid, 2% milkfat, without added vitamin A and vitamin D. This made the database virtually impossible to use because I wouldn’t want my food log to contain hard-to-read and unnecessarily complicated/long titles. Plus, this would likely make any potential users other than myself run away. I attempted to solve this problem algorithmically several times, but could not find a suitable solution. In the end, I manually relabeled the entire database myself by properly naming a couple hundred of items each day. After a lot of work, I had a reliable way to determine to Calories Consumed.

Making it Pretty – Sketch

Now that I had figured out how to determine Calories Consumed - Calories Burned = Leftover Calories, it was time to design the app. I decided to make full visual mocks of my app. In the past I had use Adobe Illustrator templates to do this. However, this time I decided to try Sketch. Sketch is a design app that is similar to Adobe Illustrator, but is intended specifically for application design. It has a great library of mobile design widgets and all of the necessary storyboards and templating. It doesn’t have quite the depth of Adobe Illustrator, but makes up for it in terms of tools targeted specifically for application design (and the one-time $99 price-tag). Check it out here.

I used the built-in iOS app design templates to mock out my app. Any widgets or design elements that weren’t immediately available I was able to easily find by googling something along the lines of "free sketch resource for [insert want you want here]". Using sketch to design the app was a great experience and was easily doable with almost no design experience whatsoever. I would recommend a tutorial for beginners though. A lot of time can be saved by understanding concepts such as layers, grouping, and re-usable templates/elements.

Sketch File For Rise Fitness

There were many interesting design challenges I came across. I’ve decided to focus on one in particular though. The primary challenge I had was how to represent to the user Calories Consumed - Calories Burned = Leftover Calories. I used a simple circle, similar to a donut, to represent how many calories a user had available at any given time. The actual calories available was shown numerically inside the circle. A user would start their day with calories available equal to their typical Resting Energy expended per day. Then as the user consumed food throughout the day calories would be subtracted from the available total and the circle would be proportionally erased. Likewise, as a user expended calories due to activity (Active Energy) the number of available calories would increase in real time and the circle would be proportionally re-filled. Thus if I ate half of my calories it would show a letter ‘c’ (a half circle). If I were then to do some exercise the ‘c’ would fill up a bit more so that it got close to an ‘o’ (a full circle). I chose this design for several reasons. The most notable were:

  • The real-time updates would encourage the user to check the app frequently and stay aware of their current calorie count
  • The ever-depleting calorie count would serve as a form of gamification, thus encouraging the user to achieve their calorie goals
  • It took all of the complexities of the Calories Consumed - Calories Burned = Leftover Calories and represented them using a single and simple widget (in addition this widget could be used on other surfaces in the future)
The Rise Fitness Progress Tracker

Using my mocks made in Sketch I was able to go ahead and implement all of the UI/UX for my app. The only thing left to do was hook it up to the backend. In order to do that I needed to finalize a few more things. Specifically, I needed to:

  1. Decide on a data storage scheme
  2. Implement some kind of search engine for the database of foods

Putting it All Together — AWS DynamoDB

I designed my database quickly and naively to start. I made three tables that corresponded to the core features of the app. They were:

  1. my_custom_foods – This contained any custom foods that the user entered that were not in the USDA food database. Its partition key was the user_id and the sort key would be the food_name. The reason for making the sort key the food name was so to use DynamoDB’s efficient begins_with query on the food_name index to easily provide a simple search feature for users that entered many custom foods.
  2. foods_eaten – This contained how much of a given food was eaten on a given day and what that food was. Its partition key was the user_id and the sort key was the order. The order corresponded to the order of foods eaten on a given day. This allowed me to efficiently get the foods eaten in the proper order to display to the user. Finally, I set a global secondary index on the day eaten. This allowed me to efficiently query for all of the foods eaten on a given day to display to the user so that I could show the current day’s foods or a past day’s foods.
  3. my_days – This contained all of the nutrients obtained on a given day from food, all of the calories consumed on a given day, and all of the calories burned on a given day. Each day corresponded to a single item in the table. The partition key was the user_id and the sort key was the date. I could thus efficiently query for a given day’s health stats. Whenever there were new health stats, the app would update the health stats entry corresponding to that day.

Using these three tables I was able to manage all of the data necessary to power the app. Further, they were setup so that I could quickly and easily compute the things that I needed to.

There’s Always Another Problem — AWS Cloudsearch

Luckily, I was able to use AWS DynamoDB to get search for ‘custom’ foods easily and quickly. However, my solution wasn’t going to work very well with my food items obtained from the USDA Food Composition Database. The reasoning for this was two-fold. The ‘prefix-style’ search I had done for ‘custom’ foods would usually work because a person would usually remember the exact name (or at least the first few characters) of any item they had entered. This wouldn’t work for all of the foods that I personally named. In addition, I expected the database of existing foods to get used more extensively and thus wanted a more robust and more scalable solution because it naturally had a lot of entries. I solved this using AWS Cloudsearch. AWS Cloudsearch allows one to upload tons of items in JSON format. It can then smartly search your items given any query string. This smart search takes into account document structure, patterns, and more to provide a powerful search feature. Each query produces a ranking of results ordered by relevancy. I wrote a few quick python scripts to convert my "properly-named version" of the USDA Food Composition Database into JSON format. I was then able to use the AWS Web UI for Cloudsearch to upload my documents directly. It is worth noting that on web the document upload size is limited to 4gb. So, you’ll either have to split your data up or use the AWS Commandline Interface for uploading large datasets.

AWS Cloudsearch did a fantastic job returning relevant results quickly and easily. However, it wasn’t cheap. I didn’t have much data at all (at least compared to typical Cloudsearch use cases), but was spending $50 a month to simply maintain my AWS Cloudsearch instance (it would cost even more once released and with user queries). It was at this point that I took a step back and re-evaluated my situation. I really didn’t have that much data; perhaps AWS Cloudsearch was overkill. I made a quick script to write my food database to a text file. I then wrote a simple search algorithm that would handle parsing and searching on the device itself (completely client-side). The search was lightning fast despite literally not adding any optimizations. It turns out the dataset was so small that a smartphone could handle it all by itself. While I was happy that I got a chance to learn AWS Cloudsearch, I was a little dissapointed that I had wasted time and money on pre-mature optimization. The moral of this little feature was to build simple and only investigate more complex solutions when those simple solutions fail. Sometimes you’ll be surprised how far a simple solution can take you.

The Final Product – The Rise Fitness App

I finally had everything I needed to put together the app. After many months of work in iOS and AWS, I completed the app. You can check it out yourself here. Below is a brief video demo of the app and how it works. Key features include:

  • Signup and Login
  • Adding foods
  • Modifying foods
  • Deleting foods
  • Track body weight
  • Automatic activity tracking with Apple Watch
  • Manual activity logging options
  • View history
  • Add custom foods
  • Recipe builder for complex food

Building For The Future – DDIA

At this point I had already released my app on the App Store (which went surprisingly smoothly) and had a few users. Everything was running fairly smoothly at first, although as more users joined some weird bugs started to turn up. The first issue I had was maintaining consistent user data. My initial design had one table for storing the foods eaten on a given day and one table for storing the health data for a given day. This would have worked fine if everything always worked as expected. But as Murphy’s law explains, if something can happen or go wrong then it will. Consider the following example: a user eats a food. In order to write that event to our database we needed to write two items. We first needed to update the foods_eaten table with the food that was eaten. This was necessary to be able to show the user a list of food eaten on that day. We then needed to update the my_days table with the latest health stats. Specifically, we needed to update the nutrients and calories consumed from the food the user had just eaten. Each of these writes were two separate events. On a spotty cellular connection it was very possible that one of the write events succeeded and one failed. This would make one’s list of food eaten and one’s health stats end up out of sync.

Another problem I had was health stats getting out of sync. Recall that health stats were stored via a single entry that corresponded to a given day in the my_days table. Health stats were updated for a given day by updating the single health stats table item for that day. The exact process was as follows:

  1. Upon app startup query the my_days table for the current health stats for the day. Save this data locally show it can be displayed to the user.
  2. Upon a change to the existing health stats update the local representation and then send that update to the my_days table to be written. There were a few things that could go wrong here. First, the local copy of the health stats and the copy in the my_days table could easily go out of sync if an error happened during writing to the table. Second, if many writes were happening at once or if there were a delay in writes then some updates could accidentally get overwritten without proper synchronization.

There were many ways to solve the above problems. I could have added better client-side synchronization and consistency checks on the database. But I wanted to pick the simplest solution because this was a side project and I was running out of available time to allot to it. My solution came in the form of a completely re-architected backend (so much for saving time…). I had recently finished reading Design Data-Intensive Applications by Martin Kleppmann. The book went through all of the different aspects of database design and their various strengths and weaknesses. The book ultimately seemed to come to the conclusion that for many applications the optimal database design would be a single immutable event log. This simplified my backend database tables as follows:

  1. my_custom_foods – I still needed a table like this to store the custom foods that a user entered into the app to supplement the list of foods available in the USDA database I had made.
  2. health_events – I consolidated my other two tables into one table that would work as a generalized immutable event log for all ‘health related’ events. Physical activity and eating food what both just be certain types of events. Events would constantly be written sequentially with a time stamp to the database in the form of health stat “deltas”. A simplistic example might be as follows, which when queried would give the health stat totals for the day (in this example +100 net calories):
    1. Event @ 12:01am 12/21/2018 – Ate food, +200 calories
    2. Event @ 7:30am 12/21/2018 – Exercise, -100 calories

More formally, the health_events table had a partition key of the user_id and a sort key of timestamp. I had a secondary index on the date so that I could efficiently query for all events that occurred on a given date. The idea was that I would query for all of the events on a given day and then process things such as calorie totals from the events on the client (the device). A single user couldn’t possibly have that many events in a single day, so the solution shouldn’t have any scaling issues processing cummulative stats based on events. Most importantly by using a single immutable event log style table all of my prior issues about data synchronization and maintaining health stat state disappeared as it was effectively stateless and had no competing writes. I’d highly recommend such a solution for anyone setting up a new data architecture.

Where We Are and Where We’re Going

There’s obviously a lot more that can be done here (I’ve provided a list of my ideas below). I’m done working on Rise Fitness for now though. The irony is that in the process of building the application I needed, I learned how to do it all in my head. That’s one of the benefits to manually relabeling an 8000 item food database and constantly pouring over activity data. Nonetheless, it has been a fantastic experience that I’ve learned from on multiple levels (health, database architecture, UI/UX, AWS… to name just a few). I hope this demonstrates how some of the latest tech can be used to build a product that makes everyone’s lives healthier and better.

More Ideas
  • Passive collection of Calories Consumed data or easier entry (such as ‘scan a meal’)
  • Other means of classifying healthiness besides calories or specific macro/micro-nutrients
  • Better Apple integration such as a watch app, a today widget, a watch complication, etc
  • Built-in suggestions to improve diet habits or goals
  • Using machine learning or some data analysis tool to make recommendations and diagnose trends

Sources

Categories
code fitness

Lift Buddy – Making A Smart Barbell Clip

Lifting Weights — The Start

I have been an athlete my whole life. I played sports all three trimesters throughout most of middle school and high school. I also regularly did mid-distance running and carried on this training through college (and still do to this day). However, I had never done any serious weightlifting prior to college. Like most I was a bit intimidated by the weight room – the smash of weights hitting the ground and the grunts of exhaustion from trying to squeak out that last rep was all a bit much. Perhaps more significantly, I wouldn’t have even known where to begin had I worked up the courage to go into the weight room.

I finally made it into the weight room my junior year of college with a group of friends that helped show me the basics. They taught me the four barbell lifts that serve as the foundation for all strength training and weightlifting. Specifically, they were: squats, bench press, deadlifts, and overhead press.

Squat, Deadlift, and Bench Press (Left-To-Right)

I spent the next two years working on and improving these "core lifts". As I got better I was able to lift more and more weight. After a while though, my progress plateaued and I stopped improving. I had finally reached the point where in order to get better I had to do more than just "show up and workout". I needed to improve my lifting form and mechanics – raw muscle and elbow grease wasn’t going to do the trick anymore.

It quickly became apparent that it would be difficult to improve my lifting form and mechanics without some kind of coach. However, this wasn’t feasible as a poor college student (and I had already spent my P.E. credits on Boxing). What I really wanted was an assistant that would provide useful tips and pointers throughout my workout. I needed something like "Clippy" from Microsoft Word. (For those that don’t know, Clippy was a virtual assistant that made suggestions in older versions of Microsoft Word).

Clippy From Microsoft Word

As I discussed this idea with some friends, a fitting idea emerged. Barbells use clips at their ends to hold the weight onto the bar so it doesn’t fall off while in motion. I could build a "smart clip" that records data during a lift and then makes recommendations afterwards. I could quite literally have my own "Clippy" that would clip onto my barbell and help me lift. I ended up using the name "Lift Buddy" instead to avoid copyright issues though.

Rapid Prototyping — Using Arduino

Prototyping electronic hardware (such as a smart barbell clip) has been historically expensive and cumbersome. However, recent developments such as cheap printed circuit boards and 3D printing have made the process much more accessible. One popular tool is Arduino. Arduino is an open-source platform for development on small microcontrollers that can interface with various sensors and tools.

Arduino Board Connected to a Sonar Sensor and LED

One can prototype a wide variety of different things by combining various sensors and tools together. For example, a startup I worked with at Cornell used Arduino to prototype smart-phone powered laser tag (Splat). Here I planned on using an Arduino board combined with various sensors to analyze the motion of the barbell as the "smart clip" moved with it. My first task was to pick out all of the sensors I would need to analyze a lift.

Accelerometers and Gyroscopes — Picking the Right Tools

One common mistake when lifting a barbell is tilting it unevenly in any direction. For example, when lifting a barbell up one needs to ensure both sides of the barbell stay level. That is, one side shouldn’t come up before the other. Any tilt can result in an uneven distribution of force, which can cause injury or cause the barbell to fall. As such, it’s very important to track any changes in the rotation of the bar. There are three types of angular rotation that can affect the bar: roll, pitch, and yaw. They can be thought of as follows:

  • Roll: Tilting the bar due to leaning to the right or left side
  • Pitch: Tiling the bar due to learning forwards or backwards
  • Yaw: Moving the bar due to turning left or right or "spinning" around
Illustration of Pitch, Roll, and Yaw for a Barbell or a Plane

I was able to use a dual accelerometer and gyroscope sensor known as the MPU6050. It allowed me to measure pitch and roll. (Measuring the yaw accurately requires an additional component due to the fact that the yaw axis is parallel with gravity making it hard to detect change in acceleration). I could now detect shifts in the position of the bar during the course of the lift. Using that information I could then make recommendations after the lift was complete.

The next type of recommendation that I wanted to be able to make was regarding the motion of the barbell. I wanted to measure the distance it moved, how fast it moved, and how quickly it accelerated. Naturally, I had thought my problem was already solved. The MPU6050 is an accelerometer and gyroscope. I thought I could use the accelerometer to measure how quickly the bar accelerated and then infer the velocity and distance from that. While I was right that it could be used to measure acceleration, the story was more complicated for velocity and distance.

One computes velocity and distance from acceleration using integration, a technique from calculus. Unfortunately, numerical integration has a certain degree of error and each time you integrate the error gets worse. Specifically, the error grows linearly for computing velocity and quadratically for computing distance (with respect to time). This meant that if my accelerometer was just 0.1 units off, then after 10 seconds my error in computing distance would be off by a factor of 100. Empirical testing confirmed this. I was unable to measure velocity or distance accurately using the accelerometer. This is the same reason many early fitness devices did such a poor job of measuring the distance you walk. They could only afford to include an accelerometer in them, which is too inaccurate to track distance over time. (They can somewhat accurately detect steps though by detecting your body accelerating each time you swing your leg). Most modern fitness devices use a combination of GPS and accelerometers to accurately track your speed and distance. This left me in a bit of a bind. How was I going to build a cheap prototype that could also measure distance and velocity? The struggles of past fitness device makers didn’t give me much hope. Luckily, I happen to find a sensor that fit my use case perfectly.

Sonar — Improving the Tools

Sonar sensors work by sending out an ultrasonic sound wave and then waiting for it to bounce back. By measuring how long it took the wave to bounce back, one can measure distance from the sonar sensor to another object. Therefore, I could use a sonar sensor aimed downwards on the barbell clip to measure the distance between the ground and the barbell. This gave me a way to measure the distance traveled by the barbell while lifting. It also gave me a good way to measure velocity. I could use calculus (specifically differentiation) to infer the velocity from the distance traveled over time. I could also measure acceleration this way if I wanted to (although I already had the accelerometer to give me acceleration readings). It turns out that any error in taking the derivative of something is significantly less than the error in integrating something. (One way to think of why this is true is because differentiation is a local operation and integration is a global one, so differentiation requires less information to compute it it accurately). Thus, I could use sonar to compute the position and velocity of the bar.

Using Sonar to Measure Distance (And Velocity)

Most sonar sensors are extremely expensive and large because they need to work across long distances. Luckily, I only needed my device to work up to a maximum distance of 10 feet (the maximum distance the barbell would be raised over one’s head). I found an Arduino-compatible sonar sensor that worked up to about 10 feet called the HC-SR04. I was now able to detect the distance the bar traveled during the lift and its velocity. This enabled me to create detailed graphs showing things such as the explosiveness of a lift or at what points in a lift one struggles. However, to create those graphs or display anything of value to the user I needed a way to get the data from the "smart clip" onto a smartphone.

Bluetooth LE — Hooking It All Up

Originally I wanted my device to work on both iOS and Android. Android wasn’t much of an issue as there weren’t many restrictions on how a device could communicate with Android. iOS, however, was a different story. Apple restricts the ability for a developer to make and distribute an app that communicates with an electronic device in many cases. Developers need to join Apple’s MFi Program and joining isn’t a simple process. Luckily, in early 2010 Bluetooth Low Energy technology was developed. Bluetooth Low Energy (BLE) is a technology that makes it easy and energy-efficient to transmit data from one device to another over a short distance. This new technology was deemed effective enough by Apple to allow any developer to use it in their apps without meeting any formal requirements. By 2012 most iOS and Android devices had support for interfacing with BLE devices. In subsequent years prices for BLE chips became increasingly affordable and eventually a cheap version was released for Arduino. This was just in time for me to use the RedBearLab BLEMini for less than $20 (which has since been discontinued). They also provided code to facilitate communication between iOS and Android. I had now completed the Arduino prototype device and was ready to start building the corresponding iOS and Android client apps.

Lift Buddy Arduino Board Diagram
Lift Buddy Prototype – Smart Clip on Bar

Immersive Lifting — The Original iOS Client

I first wanted to build an iOS app because most of the devices I used were part of the Apple ecosystem. Unfortunately, I had just about no experience in iOS development (I did have experience in Android development though). Nonetheless, I plowed ahead and learned the basics of iOS until I was able to build a simple prototype app.

I designed the app to be an immersive app rather than a "tracking" or "checklist" app. Most lifting apps have you create a workout template prior to a workout. These templates include details such as name, weight, sets, and reps. You then mark each lift as completed as you work out. Alternatively, many apps or users would simply fill out the template after completing their entire workout. This made sense because filling out that template didn’t actually help you lift. For this reason most lifting apps served as "trackers" or "checklists". My app was different though because it provided useful data and advice for each lift. This meant that a user would need to use the app as they lifted in order to get the most of out it. This required me to make some fundamental changes to the design of the standard lifting app.

I designed the app to be used during lifting. So while templates can be created and used, the logging of each lift needs to be done while the lift is being executed. The process works as follows for an individual lift:

  1. Select the lift you’re executing from a template or manually enter the name, weight, and goal number of reps.
  2. Click "start lifting" and do the lift. A "lift in progress" message is shown while the lift is being executed and Lift Buddy collects data from the smart clip.
  3. Click "complete lift" once finished. Stats from the lift are then shown to the user, along with recommendations.
  4. Begin the next lift.

This design forced the user to immerse themselves in the lift and not just treat the app as a "tracker" or "checklist".

With that design in mind, I worked through the fundamentals of iOS development and created a very rough and simple prototype app. The initial iOS app was completed around 2014 and worked in only the most basic ways. Specifically, a user could pair with the smart clip and use the app to execute and save lifts. The app displayed basic stats for each lift along with position, velocity, acceleration, pitch, and roll data. The data was often noisy and it took a few reps to get an accurate reading. Further, I had yet to implement any suggestions based on that data. I was able to dig up an old screen-recording of the app being demoed below.

Trying Again — The Android Client

After developing the initial iOS app I took a break from the project because I was finishing up my last semester at Cornell and starting a job at Amazon soon (Goodreads specifically). By time I came back to the project about a year later I was a much more experienced Android developer thanks to a final course at Cornell and my work at Amazon. This inspired me to build a more robust Android app. I planned on re-using the same "immersive design", but doing a much better job on the data processing and analysis. I also wanted to embrace a flatter and simpler design as most apps had started to move away from skeuomorphic design principles.

Initially I focused on basic Android programming. I was simply creating better-looking Android version of what I had on iOS. Most of the additional work came in the form of improving data processing and analysis. My first step was reducing "noise" from the data sent from the device. The device works by constantly streaming data over bluetooth to the smart phone. Specifically, the following lines of data are continuously sent over:

  • s:123
  • a:456:789

The s corresponds to "sonar" and the number next to it represents the distance from the barbell to the ground. The a corresponds to "accelerometer/gyroscope" and the numbers next to it represent the pitch and roll, respectively, as degrees (°).

Occasionally the sensor would return a non-sensical value due to a sensor error or some other random event. For example, a stream of sonar data might return: [10, 12, 10, 11, 15, 20, 325, 24, 26, 27, 24, 14, 10, 10, 10] This resulted in spiky graphs that were hard to read (in the example above the spike would be at value 325). I was able to remove such spikes by simply filtering out values that deviated significantly from the average value. Unfortunately though, this wasn’t enough. Occasionally the data would contain spiky "regions" rather than single values. I tried to eliminate those using the same technique – but it was a constant game of cat and mouse. Each time I fixed a type of spike or anomaly, some other would be uncovered or appear. To solve the issue more holistically I implemented a moving average on top of my other improvements. A moving average works as a smoothing function. It smooths a stream of spiky data by recording continuous averages of the data returned from the sensor instead of the sensor values themselves. This can be clearly seen below by comparing results from the app with and without the smoothing function.

The Effect of Smoothing on Velocity Data

In the example above the user is executing a series of overhead presses. The upward-facing peaks represent the bar traveling upwards until it slows down to 0 when the bar is fully lifted up. The downward-facing peaks represent the bar traveling back down until the user is ready for their next rep. In the graph with smoothing one can easily see each upward press followed by bringing the bar back down. In the graph without smoothing it’s not totally clear what is happening.

I was able to use this collection of smoothed data to make detailed recommendations based on certain characters of the graph, such as slope and shape. Specifically, for each type of data I made the following recommendations:

  • Position Data: Range of motion
  • Velocity Data: Weak points in a lift
  • Acceleration Data: Explosiveness to start/finish a lift
  • Pitch/Roll Data: Stability and form during a lift
Making a Recommendation Using Pitch/Roll Data

Where We Are and Where We’re Going

I had finally completed my prototype of "Lift Buddy" and was ready to move on to learning new things with a new project. Taking "Lift Buddy" beyond the prototype stage would have required a very large amount of effort and funding. Plus I had already gained many of the benefits that a real "Lift Buddy" device would have provided simply by making the prototype. All of the research I did into lifting mechanics and measurement helped me significantly with my own lifting form. So even though I didn’t quite have a finished product that I could use everyday – I still ended up benefiting as if I had. In the future I hope to further explore how technology can be used to improve health. I’ve included a live demo below.