Getting Fitter — The Start
Everyone knows the hackneyed trope "you are what you eat." There’s not much debate over whether the phrase is true or not. It’s largely accepted as fact. But if we all know this, then why are so many of us so unhealthy? Two thirds of all Americans have been obese at some point in their life and almost half are right now.¹ Obesity related health issues are costing us hundreds of billions of dollars and millions of lives.² While there is no single cause or solution for this, one obvious (partial) answer is a simple addendum to that hackneyed trope: "you are what you eat and how much."
I first started to care about what I ate, and how much, when I started lifting weights in college. I kept training and practicing, but I wasn’t getting much stronger. Eventually I determined that my limiting factor was muscle mass. I needed to put on more muscle and to do that I needed to eat more. I tried and struggled to eat enough and didn’t see much progress. Having majored in physics up to that point, I knew that the First Law of Thermodynamics explained that energy is conserved in a closed system. If I let my body be the closed system while having energy entering the system be food consumption and energy exiting the system be bodily activity, then I could model my mass (recall energy is mass). My mass would change according to whether more food entered my body or more bodily activity was done. Specifically, I could control my weight fairly accurately day-by-day using: Calories Consumed - Calories Burned = Leftover Calories. If my Leftover Calories were positive for a day, then I must be gaining weight because I’m consuming more than I’m burning. Likewise, if it was negative then I must be losing weight because I’m burning more calories than I’m consuming. In order to do take advantage of this equation I needed a way to log how many calories I consumed and burned each day. Thus began my journey into diet tracking.
Beginner’s Luck — MyFitnessPal and TDEE
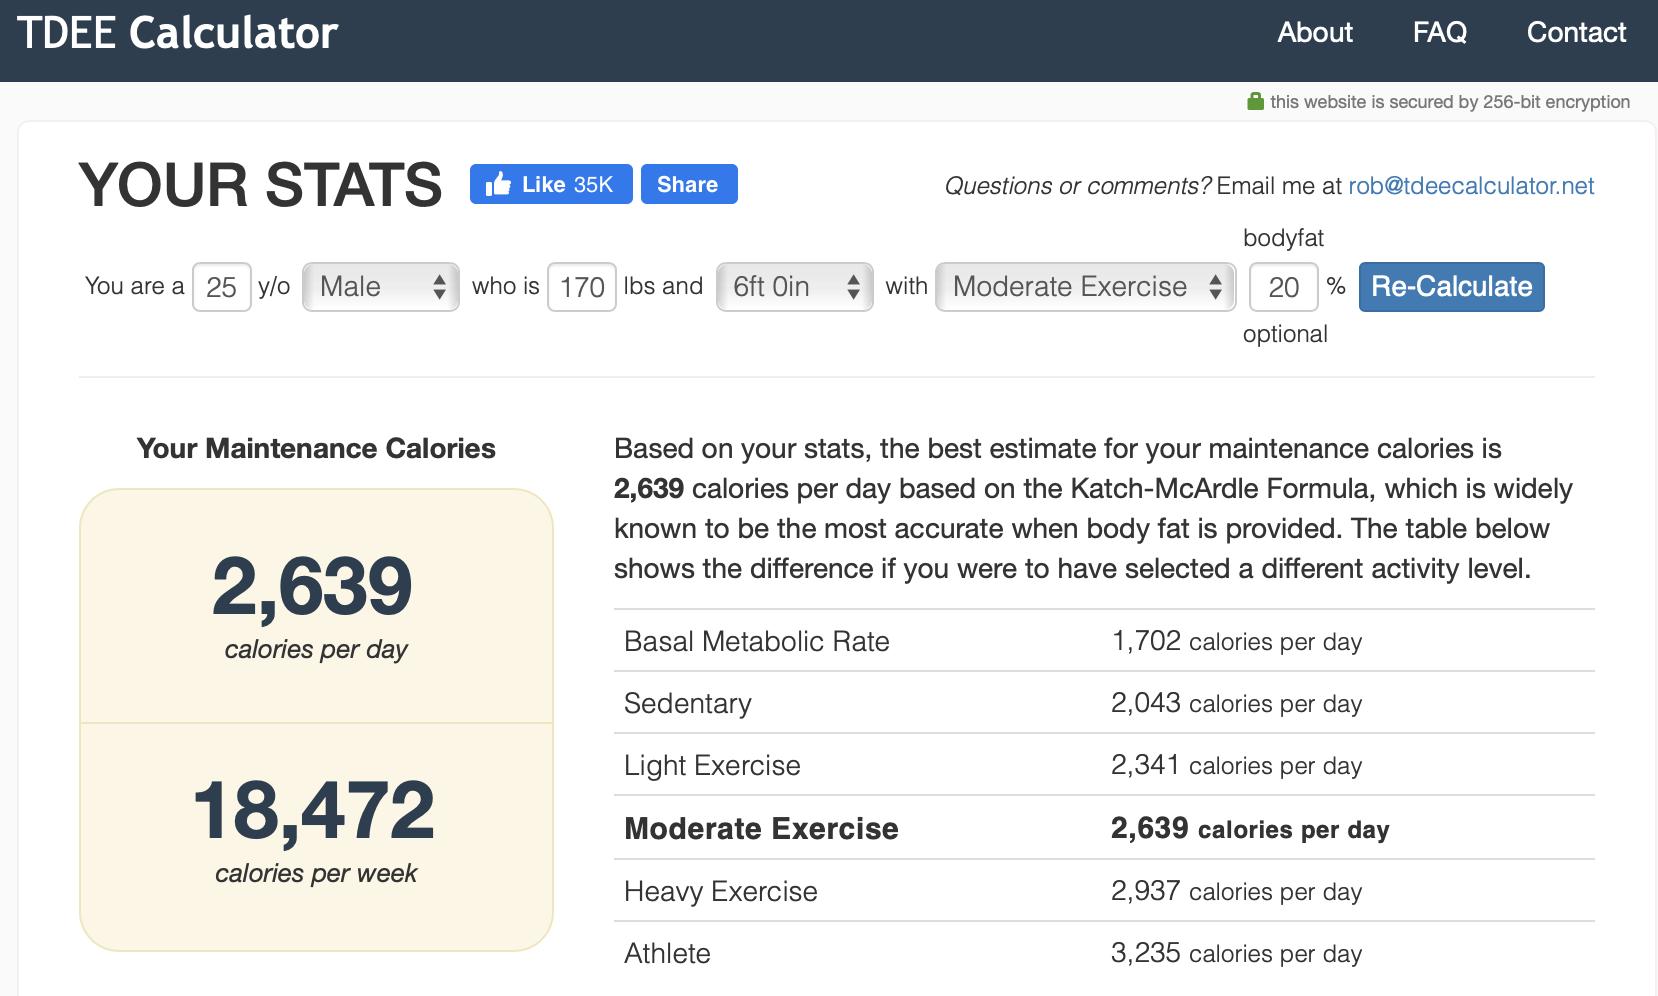
The first step was determining how many calories I burned and how many I consumed. In 2014 there weren’t many great ways for the average person to track calories burned precisely. However, there were some simple formulas that had proven to be fairly effective. After a little bit of googling I settled on calculating my Total Daily Energy Expenditure (TDEE). This is a simple estimate based on one’s average daily activity level and the calories they burn from that along with their Basal Metabolic Rate (BMR). One’s BMR accounts for the calories one burns from just living (such as breathing and other basic bodily functions) without any additional activity or movement. This can be estimated given several body measurements, such as weight and height. Most TDEE calculators are improved further using other information such as the thermic effect of food eaten. Give it a try yourself here.
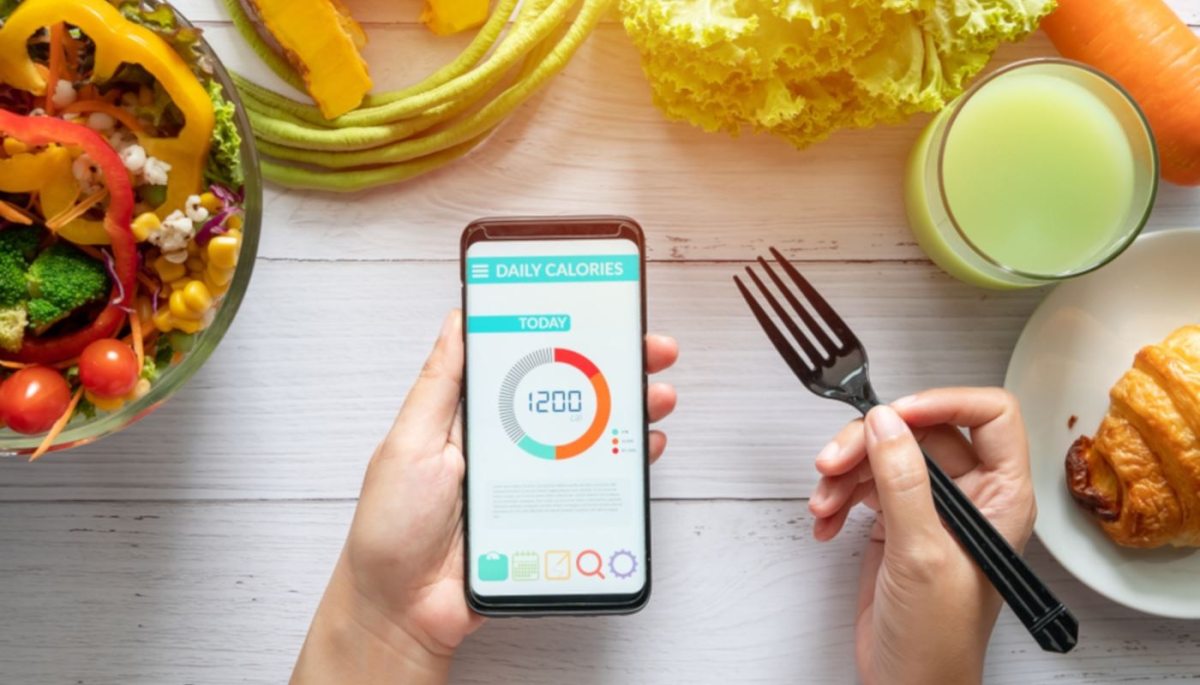
That gave me the Calories Burned portion of my equation. The last thing I needed was the calories I had consumed in a given day. The obvious solution was to count my calories. Luckily, there was a well-known app called MyFitnessPal that I used. MyFitnessPal allowed me to scan barcodes and enter foods by name and log them against a daily calorie limit. Thus, I could calculate my daily Calories Consumed. And there I had it, both parts of the equation.

Armed with this knowledge I was able to easily determine how many calories I had to eat to gain or lose weight. I struggled at first to properly use MyFitnessPal. In a college dining hall there aren’t any barcodes, nutrition facts, or food scales. However, with a bit of struggle I found a few good techniques. I was able to get pretty good at estimating portion sizes with a bit of practice (try this position size estimator out for practice). I was also able to find most food items in the app after a bit of searching around. After several months I had managed to put on almost 20 pounds. It was a success… for now.
Peaks and Troughs — LifeSum and Apple Watch
My fitness journey didn’t end after I gained those 20 pounds. In fact, it had just begun. Over the next two years I continued to track my daily calorie intake and expenditure. I also continued powerlifting, running, and cycling to improve my physical fitness. It was at around this point that the system I had built using MyFitnessPal and TDEE started to fall apart. The first problem I had was with TDEE. Most versions of TDEE estimate a single daily calorie expenditure. This can be accurate for non-athletes and people that do not have much variation in their daily activity levels. However, this models breaks down when engaging in specific bouts of intense physical activity. For example, on my cycling days I’d easily burn over 1000 calories. On the other hand, on a rest day I’d only burn a small fraction of that. This meant that my calorie goal wasn’t accurate day-to-day. On cycling days I’d end up under-eating because my TDEE would be lower than the number of calories I burned. On rest days I’d end up over-eating because my TDEE would be higher than the number of calories I burned (because I didn’t work out that day).
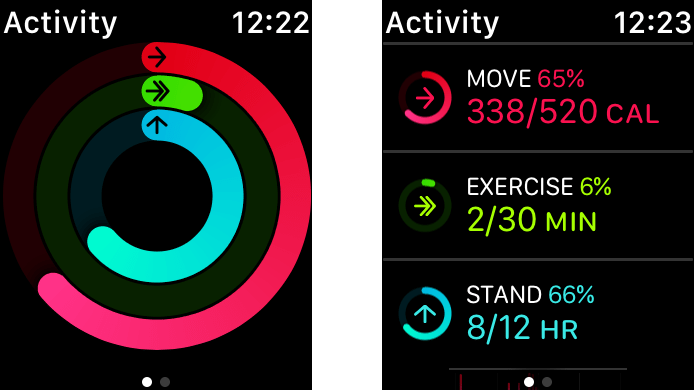
I needed a way to track my calories burned due to activity on a day-by-day basis. Luckily, I was able to find something even better. I got an Apple Watch Series 2 (Nike+ Edition) that tracked my calories burned due to activity minute-by-minute (it also tracked my BMR minute-by-miute). The Apple Watch uses a variety of biometric data to determine in real-time how many calories you’ve expended while just being at rest and while being active. This is known as your Resting Calories and Active Calories, respectively. I was able to use these two statistics to accurately figure out how many calories I was actually burning each day. Namely, Calories Burned = Resting Calories + Active Calories.
Unfortunately, my Apple Watch only solved half of my problem. My other problem was MyFitnessPal. It was getting pretty annoying keeping track of Calories Consumed and Calories Burned separately. I wanted a one-stop-shop where I could view my daily Leftover Calories in the same place where I viewed my Calories Consumed and Calories Burned. I found an app that did exactly this — LifeSum. LifeSum worked exactly like MyFitnessPal (albeit with a smaller selection of foods to log), except it would also sync with my Apple Watch. This allowed me to actually manage and view my total calories consumed, burned, and leftover all in one place.
We Have A Problem — Rise Fitness
My new system using LifeSum and Apple Watch was definitely an improvement, but it still wasn’t quite perfect. The first issue I had was the Apple Watch/Health integration with LifeSum. The integration didn’t work most of the time. The LifeSum app was not using my Resting Calories plus Active Calories to determine Calories Burned, but instead a combination of Active Calories plus additional calories burned for each exercise I did (you can log individual workouts using your Apple Watch). I’m not totally sure why their accounting system was so off or the details of its implementation that made it that way, but I regularly had incorrect activity totals. For example, after a bike ride it had told me I burned 3000 calories (1800 due to ‘activity’ and 1200 due to ‘biking’). The value was clearly wrong because it was double counting the bike ride by polling for the exercise calories plus the cummulative active energy calories. Regardless, it didn’t work for me and I couldn’t find any other app that accurately integrated with Apple Watch data and contained sufficient nutrition information.
That wasn’t my only issue. As I began to read and learn about nutrition it became apparent that most of the diet tracking apps on the market were missing the mark. The first issue was accuracy. The vast majority of items in most apps’ food databases were entered manually by regular users. Further, the catalog of food items was not curated nor checked for accuracy. As a result, many of the stats were objectively incorrect. For example, consider the top two results when searching ‘carrot’ on MyFitnessPal.
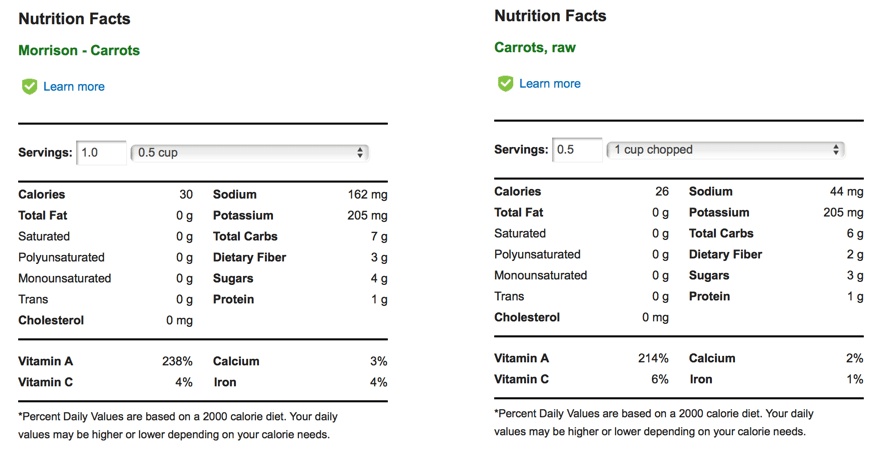
As one can see, despite both being ‘verified’ there must be someting wrong with at least one because they don’t match. The results get increasingly incorrect for less common food and especially for meats. Another common issue was a lack of specificity. There is a big difference between ‘cooked carrots’ and ‘raw carrots’. It has been shown cooking fruits and vegetables drastically reduces their Vitamin C content (note: this doesn’t mean you shouldn’t cook your fruits and veggies; in fact cooking can often bring out other antioxidants such as lycopene in cooked tomatoes).³ Similar logic applies to cooking meats in different ways (frying in oil versus braising can produce drastically different nutrition values for example). The vast majority of apps do not have entries to account for this and do not make this difference clear to their users. The impacts of this could be significant. Imagine a user that is tracking their daily levels of Vitamin C to meet a health-related goal. If the user is eating steamed carrots all day, but is just using the default ‘carrot’ entry that is shown in most apps, then there will be a big difference between their expected and actual Vitamin C intake. Their app will report a large Vitamin C intake, whereas in reality it will be much less because cooking the carrots reduces the amount of Vitamin C.
By this time I had been monitoring my calorie intake for over 3 years, but still didn’t have an all-in-one solution to visualizing/tracking the simple equation: Calories Consumed - Calories Burned = Leftover Calories. It was at this point that I finally threw in the towel and decided to try my hand at building my own version.
Building Fast — AWS Mobile Hub
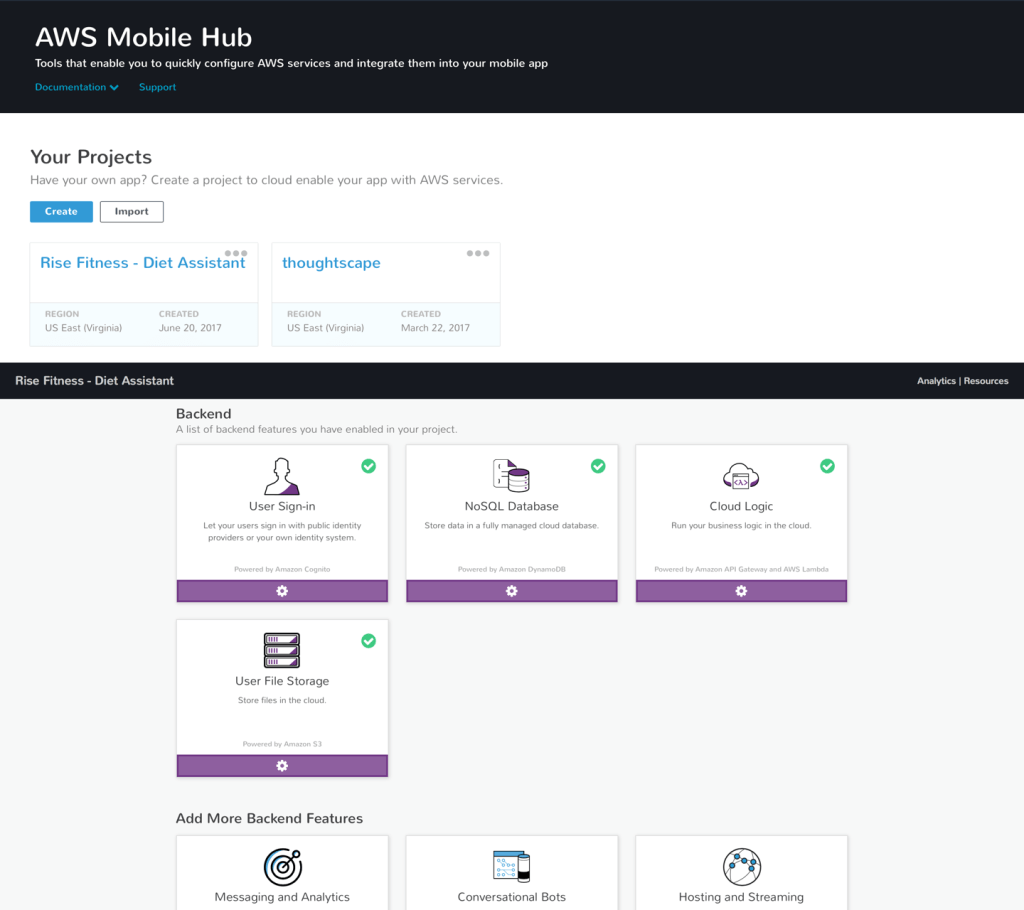
I wanted to build this app fast, but I also wanted to get some practice with AWS services. Normally these two things don’t go together; if you want to build an app fast, then worrying about scaling to millions on AWS is probably overkill. Nonetheless, I wanted to do both for for educational purposes. Luckily, there was a simple solution: AWS Mobile Hub. AWS Mobile Hub is a one-stop-shop for all of the core AWS services that one may want to integrate into their mobile app. AWS Mobile Hub works as follows. AWS Mobile Hub is broken up into a list of projects. Each project corresponds to a mobile app. Note that a project can be made for an existing app or for a new app. When inside a project view, one is presented with a variety of different feature options that can be integrated item-by-item into an app. Within each feature option are instructions on how to configure the feature and integrate it into your mobile app. Integration is easy because each feature has an entire sample project demonstrating its usage. In addition, all of the code you’ll need for your feature is generated for you in 4 different languages (Objective-C, Swift, Java, and Javascript). All of the "busywork" (such as setting up your own DynamoDB instance or alarming/logging) is completely taken care of behind the scenes. This reduces the chance of errors during setup, as well as time wasted on tedious setup steps.
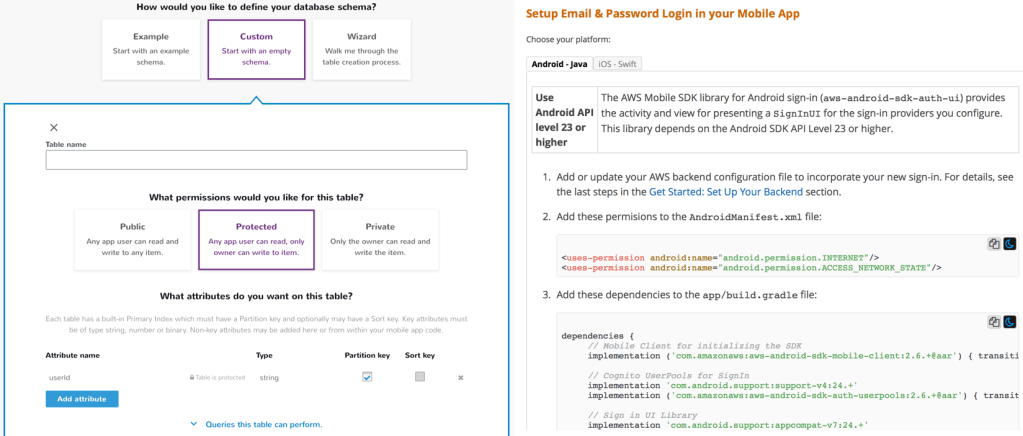
For this project I primarily used DynamoDB and Email Sign-in/Sign-up, although I have since used just about every feature offered and have had a good experience with most. Integrating both features was quick and straight-forward. I was able to quickly setup relevant DynamoDB tables using the AWS MobileHub Web UI. I was then able to easily use them in my app by using my cusotmized AWS Mobile Hub sample application as a reference. Email Sign-in/Sign-up integration was even easier. I specified a few default preferences and then AWS setup all of the necessary resources and generated all of the code to integrate the feature into my app. All it took was tweaking a few values and some copy-pasting and I was all setup in under an hour (my backend, auth, and sign-up/login portal). Thus, I was able to setup most of the details of my AWS-scale backend in one quick session.
Dot The I’s and Cross The T’s — Apple HealthKit
AWS Mobile Hub helped me setup the infrastructure to build my app, but now I needed to work on building out the features necessary to track my activity and diet. I started with tracking my activity. Naturally, I choose to do this using Apple HealthKit and Apple Watch. Developers can access the data that the Apple Watch passively tracks with Apple HealthKit (check it out here). The Apple HealthKit API was suprisingly easy to use and left me wondering why so many apps get health-related calculations wrong. The two values I was interested in were HKQuantityTypeIdentifierActiveEnergyBurned and HKQuantityTypeIdentifierBasalEnergyBurned (note that this is exactly the Active Calories and Resting Calories mentioned earlier). I was able to compute Active Calories by simply querying for the HKQuantityTypeIdentifierActiveEnergyBurned total over the course of a day. I decided to compute the typical Resting Calories one would burn on a given day using a 30 prior-day average of the HKQuantityTypeIdentifierBasalEnergyBurned. I took a 30 day average in order to get an accurate and balanced value for Resting Calories. A person generally burns the same amount of Resting Calories each day over a month because the energy it takes to simply ‘stay alive’ each day doesn’t vary much outside of dramatic body changes (significant weight loss/gain, a medical condition, etc). Thus I could determine an accurate daily Calories Burned according to Calories Burned = Actives Calories + Resting Calories. Specifically Calories Burned = [today's HK...ActiveEnergyBurned] + [30 day average of HK...BasalEnergyBurned]. All that was left was determining the Calories Consumed and I could completely model my mass.
Diamond in The Rough — USDA Food Composition Databases
Now it was time for the hard part. I needed a way to log everything I had eaten in a given day and tally up the corresponding calorie and nutrition data. I immediately had difficulty finding any kind of nutrition database that was accurate and comprehensive. MyFitnessPal and others had their food databases built up overtime through user submissions. There were several free (and paid) resources for querying nutrition data, but they were all either highly inaccurate or not available to a sole developer. Luckily, I was able to find one good source of information: the USDA Food Composition Databases (browse the databases yourself here).
The USDA Food Composition Database has accurate, verified nutrition data for almost 10,000 different food items. The database contains far more information than the typical nutrition label, including better breakdowns of fats and micronutrients. There were two problems with the database though. First, the database largely only contained ‘base’ ingredients (meats, grains, veggies, etc.) and lacked a great deal of processed or "finished: food ("finished" here refers to completed meals such as Chicken Alfredo). This was not much of a problem for me because I tried to stay away from any processed food. Plus I had planned on making a ‘recipe builder’ feature that could be used to create more complicated meals (such as Chicken Fajitas) out of simple base ingredients. Second, every item in the database was lacking a human-readable label. For example, the entry for 2% milk is: 01174, Milk, reduced fat, fluid, 2% milkfat, without added vitamin A and vitamin D. This made the database virtually impossible to use because I wouldn’t want my food log to contain hard-to-read and unnecessarily complicated/long titles. Plus, this would likely make any potential users other than myself run away. I attempted to solve this problem algorithmically several times, but could not find a suitable solution. In the end, I manually relabeled the entire database myself by properly naming a couple hundred of items each day. After a lot of work, I had a reliable way to determine to Calories Consumed.
Making it Pretty – Sketch
Now that I had figured out how to determine Calories Consumed - Calories Burned = Leftover Calories, it was time to design the app. I decided to make full visual mocks of my app. In the past I had use Adobe Illustrator templates to do this. However, this time I decided to try Sketch. Sketch is a design app that is similar to Adobe Illustrator, but is intended specifically for application design. It has a great library of mobile design widgets and all of the necessary storyboards and templating. It doesn’t have quite the depth of Adobe Illustrator, but makes up for it in terms of tools targeted specifically for application design (and the one-time $99 price-tag). Check it out here.
I used the built-in iOS app design templates to mock out my app. Any widgets or design elements that weren’t immediately available I was able to easily find by googling something along the lines of "free sketch resource for [insert want you want here]". Using sketch to design the app was a great experience and was easily doable with almost no design experience whatsoever. I would recommend a tutorial for beginners though. A lot of time can be saved by understanding concepts such as layers, grouping, and re-usable templates/elements.

There were many interesting design challenges I came across. I’ve decided to focus on one in particular though. The primary challenge I had was how to represent to the user Calories Consumed - Calories Burned = Leftover Calories. I used a simple circle, similar to a donut, to represent how many calories a user had available at any given time. The actual calories available was shown numerically inside the circle. A user would start their day with calories available equal to their typical Resting Energy expended per day. Then as the user consumed food throughout the day calories would be subtracted from the available total and the circle would be proportionally erased. Likewise, as a user expended calories due to activity (Active Energy) the number of available calories would increase in real time and the circle would be proportionally re-filled. Thus if I ate half of my calories it would show a letter ‘c’ (a half circle). If I were then to do some exercise the ‘c’ would fill up a bit more so that it got close to an ‘o’ (a full circle). I chose this design for several reasons. The most notable were:
- The real-time updates would encourage the user to check the app frequently and stay aware of their current calorie count
- The ever-depleting calorie count would serve as a form of gamification, thus encouraging the user to achieve their calorie goals
- It took all of the complexities of the
Calories Consumed - Calories Burned = Leftover Caloriesand represented them using a single and simple widget (in addition this widget could be used on other surfaces in the future)

Using my mocks made in Sketch I was able to go ahead and implement all of the UI/UX for my app. The only thing left to do was hook it up to the backend. In order to do that I needed to finalize a few more things. Specifically, I needed to:
- Decide on a data storage scheme
- Implement some kind of search engine for the database of foods
Putting it All Together — AWS DynamoDB
I designed my database quickly and naively to start. I made three tables that corresponded to the core features of the app. They were:
my_custom_foods– This contained any custom foods that the user entered that were not in the USDA food database. Its partition key was theuser_idand the sort key would be thefood_name. The reason for making the sort key the food name was so to use DynamoDB’s efficientbegins_withquery on thefood_nameindex to easily provide a simple search feature for users that entered many custom foods.foods_eaten– This contained how much of a given food was eaten on a given day and what that food was. Its partition key was theuser_idand the sort key was theorder. The order corresponded to the order of foods eaten on a given day. This allowed me to efficiently get the foods eaten in the proper order to display to the user. Finally, I set a global secondary index on the day eaten. This allowed me to efficiently query for all of the foods eaten on a given day to display to the user so that I could show the current day’s foods or a past day’s foods.my_days– This contained all of the nutrients obtained on a given day from food, all of the calories consumed on a given day, and all of the calories burned on a given day. Each day corresponded to a single item in the table. The partition key was theuser_idand the sort key was thedate. I could thus efficiently query for a given day’s health stats. Whenever there were new health stats, the app would update the health stats entry corresponding to that day.
Using these three tables I was able to manage all of the data necessary to power the app. Further, they were setup so that I could quickly and easily compute the things that I needed to.
There’s Always Another Problem — AWS Cloudsearch
Luckily, I was able to use AWS DynamoDB to get search for ‘custom’ foods easily and quickly. However, my solution wasn’t going to work very well with my food items obtained from the USDA Food Composition Database. The reasoning for this was two-fold. The ‘prefix-style’ search I had done for ‘custom’ foods would usually work because a person would usually remember the exact name (or at least the first few characters) of any item they had entered. This wouldn’t work for all of the foods that I personally named. In addition, I expected the database of existing foods to get used more extensively and thus wanted a more robust and more scalable solution because it naturally had a lot of entries. I solved this using AWS Cloudsearch. AWS Cloudsearch allows one to upload tons of items in JSON format. It can then smartly search your items given any query string. This smart search takes into account document structure, patterns, and more to provide a powerful search feature. Each query produces a ranking of results ordered by relevancy. I wrote a few quick python scripts to convert my "properly-named version" of the USDA Food Composition Database into JSON format. I was then able to use the AWS Web UI for Cloudsearch to upload my documents directly. It is worth noting that on web the document upload size is limited to 4gb. So, you’ll either have to split your data up or use the AWS Commandline Interface for uploading large datasets.
AWS Cloudsearch did a fantastic job returning relevant results quickly and easily. However, it wasn’t cheap. I didn’t have much data at all (at least compared to typical Cloudsearch use cases), but was spending $50 a month to simply maintain my AWS Cloudsearch instance (it would cost even more once released and with user queries). It was at this point that I took a step back and re-evaluated my situation. I really didn’t have that much data; perhaps AWS Cloudsearch was overkill. I made a quick script to write my food database to a text file. I then wrote a simple search algorithm that would handle parsing and searching on the device itself (completely client-side). The search was lightning fast despite literally not adding any optimizations. It turns out the dataset was so small that a smartphone could handle it all by itself. While I was happy that I got a chance to learn AWS Cloudsearch, I was a little dissapointed that I had wasted time and money on pre-mature optimization. The moral of this little feature was to build simple and only investigate more complex solutions when those simple solutions fail. Sometimes you’ll be surprised how far a simple solution can take you.
The Final Product – The Rise Fitness App
I finally had everything I needed to put together the app. After many months of work in iOS and AWS, I completed the app. You can check it out yourself here. Below is a brief video demo of the app and how it works. Key features include:
- Signup and Login
- Adding foods
- Modifying foods
- Deleting foods
- Track body weight
- Automatic activity tracking with Apple Watch
- Manual activity logging options
- View history
- Add custom foods
- Recipe builder for complex food
Building For The Future – DDIA
At this point I had already released my app on the App Store (which went surprisingly smoothly) and had a few users. Everything was running fairly smoothly at first, although as more users joined some weird bugs started to turn up. The first issue I had was maintaining consistent user data. My initial design had one table for storing the foods eaten on a given day and one table for storing the health data for a given day. This would have worked fine if everything always worked as expected. But as Murphy’s law explains, if something can happen or go wrong then it will. Consider the following example: a user eats a food. In order to write that event to our database we needed to write two items. We first needed to update the foods_eaten table with the food that was eaten. This was necessary to be able to show the user a list of food eaten on that day. We then needed to update the my_days table with the latest health stats. Specifically, we needed to update the nutrients and calories consumed from the food the user had just eaten. Each of these writes were two separate events. On a spotty cellular connection it was very possible that one of the write events succeeded and one failed. This would make one’s list of food eaten and one’s health stats end up out of sync.
Another problem I had was health stats getting out of sync. Recall that health stats were stored via a single entry that corresponded to a given day in the my_days table. Health stats were updated for a given day by updating the single health stats table item for that day. The exact process was as follows:
- Upon app startup query the
my_daystable for the current health stats for the day. Save this data locally show it can be displayed to the user. - Upon a change to the existing health stats update the local representation and then send that update to the
my_daystable to be written. There were a few things that could go wrong here. First, the local copy of the health stats and the copy in themy_daystable could easily go out of sync if an error happened during writing to the table. Second, if many writes were happening at once or if there were a delay in writes then some updates could accidentally get overwritten without proper synchronization.
There were many ways to solve the above problems. I could have added better client-side synchronization and consistency checks on the database. But I wanted to pick the simplest solution because this was a side project and I was running out of available time to allot to it. My solution came in the form of a completely re-architected backend (so much for saving time…). I had recently finished reading Design Data-Intensive Applications by Martin Kleppmann. The book went through all of the different aspects of database design and their various strengths and weaknesses. The book ultimately seemed to come to the conclusion that for many applications the optimal database design would be a single immutable event log. This simplified my backend database tables as follows:
my_custom_foods– I still needed a table like this to store the custom foods that a user entered into the app to supplement the list of foods available in the USDA database I had made.health_events– I consolidated my other two tables into one table that would work as a generalized immutable event log for all ‘health related’ events. Physical activity and eating food what both just be certain types of events. Events would constantly be written sequentially with a time stamp to the database in the form of health stat “deltas”. A simplistic example might be as follows, which when queried would give the health stat totals for the day (in this example +100 net calories):- Event @ 12:01am 12/21/2018 – Ate food, +200 calories
- Event @ 7:30am 12/21/2018 – Exercise, -100 calories
More formally, the health_events table had a partition key of the user_id and a sort key of timestamp. I had a secondary index on the date so that I could efficiently query for all events that occurred on a given date. The idea was that I would query for all of the events on a given day and then process things such as calorie totals from the events on the client (the device). A single user couldn’t possibly have that many events in a single day, so the solution shouldn’t have any scaling issues processing cummulative stats based on events. Most importantly by using a single immutable event log style table all of my prior issues about data synchronization and maintaining health stat state disappeared as it was effectively stateless and had no competing writes. I’d highly recommend such a solution for anyone setting up a new data architecture.
Where We Are and Where We’re Going
There’s obviously a lot more that can be done here (I’ve provided a list of my ideas below). I’m done working on Rise Fitness for now though. The irony is that in the process of building the application I needed, I learned how to do it all in my head. That’s one of the benefits to manually relabeling an 8000 item food database and constantly pouring over activity data. Nonetheless, it has been a fantastic experience that I’ve learned from on multiple levels (health, database architecture, UI/UX, AWS… to name just a few). I hope this demonstrates how some of the latest tech can be used to build a product that makes everyone’s lives healthier and better.
More Ideas
- Passive collection of
Calories Consumeddata or easier entry (such as ‘scan a meal’) - Other means of classifying healthiness besides calories or specific macro/micro-nutrients
- Better Apple integration such as a watch app, a today widget, a watch complication, etc
- Built-in suggestions to improve diet habits or goals
- Using machine learning or some data analysis tool to make recommendations and diagnose trends